. 2013 Jun 27;121(26):5218-27.
doi: 10.1182/blood-2013-03-488080. Epub 2013 May 23.

Analysis of disease-causing GATA1 mutations in murine gene complementation systems

Affiliations

Analysis of disease-causing GATA1 mutations in murine gene complementation systems

Amy E Campbell et al. Blood. .

Abstract

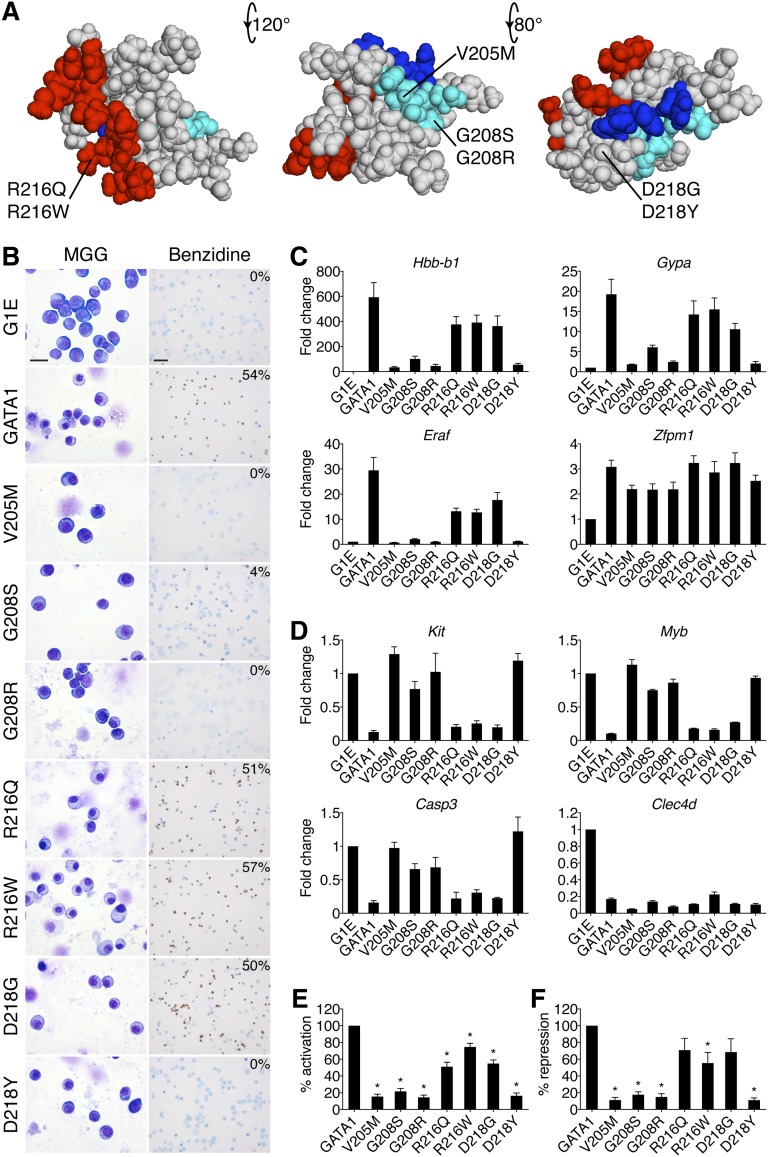
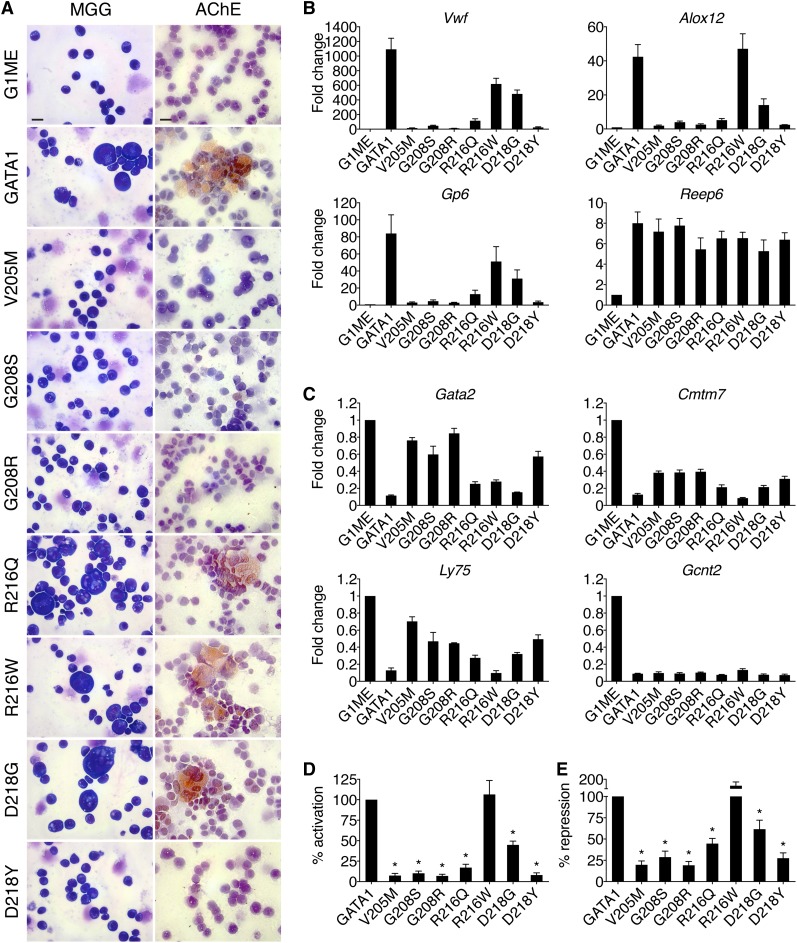
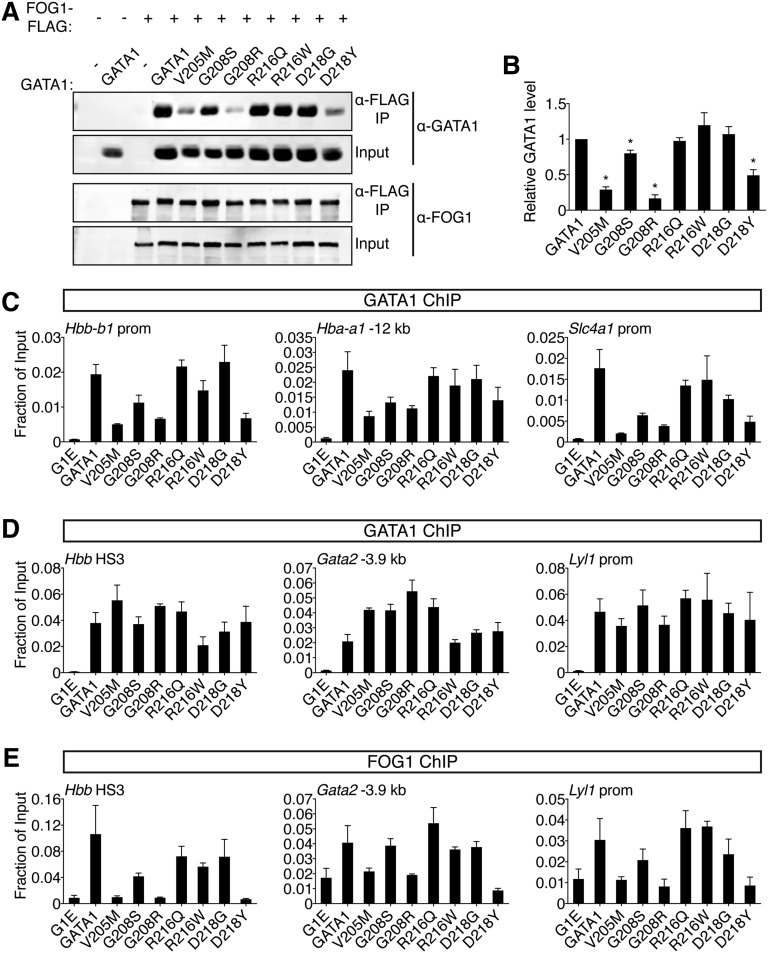
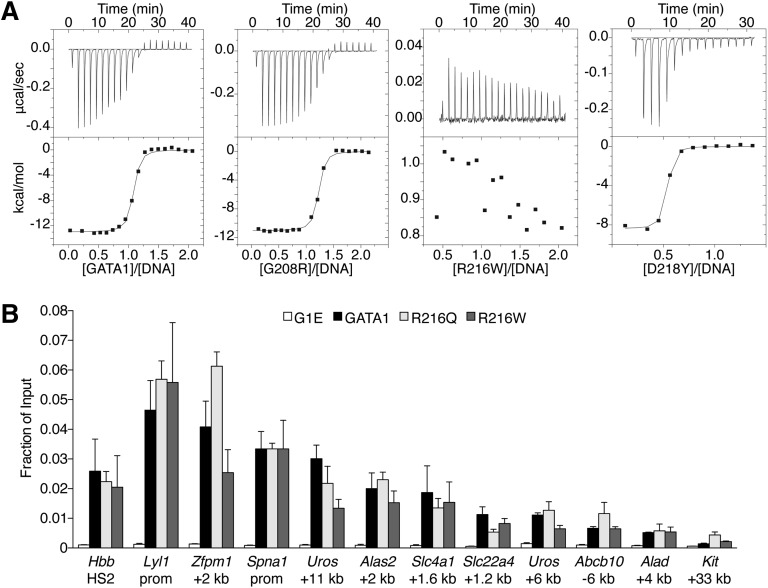
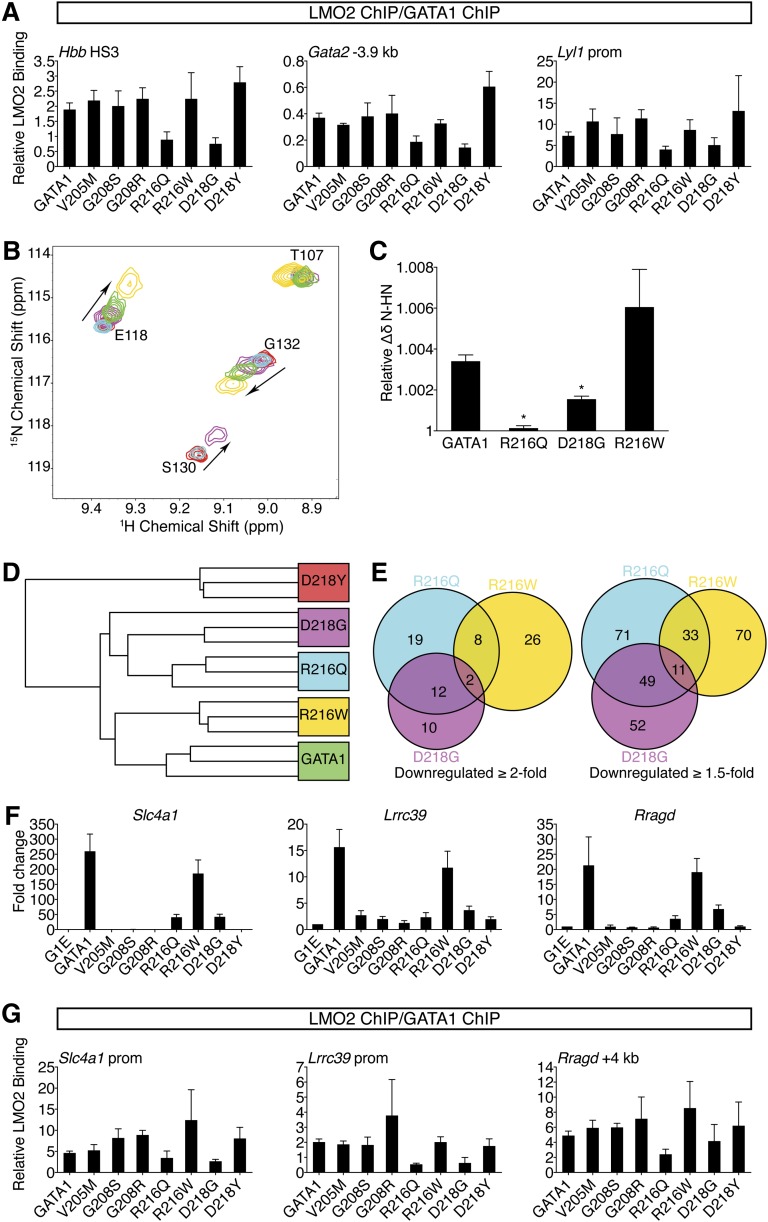
Missense mutations in transcription factor GATA1 underlie a spectrum of congenital red blood cell and platelet disorders. We investigated how these alterations cause distinct clinical phenotypes by combining structural, biochemical, and genomic approaches with gene complementation systems that examine GATA1 function in biologically relevant cellular contexts. Substitutions that disrupt FOG1 cofactor binding impair both gene activation and repression and are associated with pronounced clinical phenotypes. Moreover, clinical severity correlates with the degree of FOG1 disruption. Surprisingly, 2 mutations shown to impair DNA binding of GATA1 in vitro did not measurably affect in vivo target gene occupancy. Rather, one of these disrupted binding to the TAL1 complex, implicating it in diseases caused by GATA1 mutations. Diminished TAL1 complex recruitment mainly impairs transcriptional activation and is linked to relatively mild disease. Notably, different substitutions at the same amino acid can selectively inhibit TAL1 complex or FOG1 binding, producing distinct cellular and clinical phenotypes. The structure-function relationships elucidated here were not predicted by prior in vitro or computational studies. Thus, our findings uncover novel disease mechanisms underlying GATA1 mutations and highlight the power of gene complementation assays for elucidating the molecular basis of genetic diseases.


Figures

Figure 1
Figure 1
Impairment of erythroid differentiation by GATA1 mutations. (A) Space-filling model of the GATA1 NF from PDB code 1Y0J with DNA-binding residues in red (based on PDB code 1GAT), FOG1-binding residues in cyan, and LMO2-interacting residues in blue. The locations of disease-associated mutations are noted. The middle structure has been rotated 120 degrees around a horizontal axis from the leftmost model, and the rightmost structure is rotated a further 80 degrees. (B) MGG and benzidine staining of G1E cells expressing wild-type or mutant GATA1 after 72 hours of E2 treatment. The percentage of hemoglobin-positive cells is indicated in the upper right corner of each benzidine panel. Scale bars, 20 μm (left panels) and 50 μm (right panels). (C-D) Expression of (C) GATA1-activated and (D) GATA1-repressed genes after 24 hours of E2 treatment as determined by RT-qPCR, normalized to β-actin and plotted as fold change from uninfected samples. (E-F) Average transcriptional profiles after 24 hours of E2 treatment of all activated (E, n = 24) and repressed (F, n = 6) genes examined. Note that the reduction in transcriptional repression by R216Q and D218G is not statistically significant. *P < .05. All error bars denote SEM (n = 3) unless otherwise noted. MGG, May-Grünwald-Giemsa; PDB, Protein Data Bank.
Figure 2
Figure 2
Effects of GATA1 mutations on megakaryocytic maturation. (A) MGG and AChE staining of G1ME cells 72 hours after infection with wild-type or mutant GATA1-expressing vector. Scale bars, 20 μm. (B-C) Expression of (C) GATA1-activated and (D) GATA1-repressed genes in FACS-purified CD42-positive megakaryocytes as determined by RT-qPCR, normalized to β-actin and plotted as fold change from uninfected samples. (D-E) Average transcriptional activities (72 hours following transduction) of all examined activated (D, n = 10) and repressed (E, n = 6) genes. *P < .05. All error bars denote SEM (n = 3) unless otherwise noted. AChE, acetylcholinesterase.
Figure 3
Figure 3
Comparative analysis of GATA1 mutations on FOG1 binding. (A) Wild-type or mutant GATA1 was coexpressed with FLAG-tagged FOG1 in HEK-293 cells and analyzed by anti-FLAG IP followed by anti-GATA1 or anti-FOG1 western blotting. Input represents 5% of lysate. (B) Quantification of western blot signals. (C-D) Anti-GATA1 ChIP in G1E cells expressing indicated GATA1 versions after 24 hours of E2 treatment. (C) FOG1-dependent binding sites and (D) FOG1-independent binding sites that contain single (Hbb HS3, Gata2 -3.9 kb) or palindromic (Lyl1 prom) motifs and regulate activated (Hbb) or repressed (Gata2, Lyl1) genes. (E) Anti-FOG1 ChIP at FOG1-independent GATA1 binding sites. *P < .05. All error bars denote SEM (n = 3).
Figure 4
Figure 4
Analysis of GATA1 mutations for DNA binding. (A) ITC data showing the titration of wild-type or indicated mutant versions of the GATA1 NF into a 16-bp oligonucleotide containing a GATC motif. (B) Anti-GATA1 ChIP in G1E cells expressing wild-type or mutant GATA1 after 24 hours of E2 treatment using primers spanning single (Hbb HS2) or palindromic (all others) motifs. All error bars denote SEM (n = 3).
Figure 5
Figure 5
R216Q and D218G mutations disrupt LMO2 binding and produce unique transcriptional signatures. (A) Anti-GATA1 and anti-LMO2 ChIP in G1E cells expressing wild-type or mutant GATA1 after 24 hours of E2 treatment using primers as in Figure 3D and E. LMO2 ChIP signals were normalized to GATA1 ChIP signals at each site. Error bars denote SEM (n = 3). (B) A portion of the 15N-HSQC spectra of 15N-LMO2LIM2-Ldb1LID (red peaks) following addition of 1 equivalent of either GATA1 NF (green), R216Q (cyan), R216W (gold), or D218G (purple). R216W caused peak shifts similar to those induced by wild type, while D218G induced qualitatively similar shifts that were smaller in magnitude, and R216Q did not result in significant shifts to any peaks. (C) Relative weighted average change in chemical shift position of resonances from LMO2LIM2-Ldb1LID (B) following addition of wild-type or mutant GATA1 NF. Shown are the average shifts (±SD) of 3 separate resonances for each series of titrations. *P < .05. (D) Unsupervised hierarchical clustering of G1E cells expressing wild-type or mutant GATA1 based on expression profiling with microarrays. One D218G replicate is indistinguishable from the R216Q replicates. (E) Venn diagrams of direct GATA1-activated target genes significantly downregulated when compared with wild-type GATA1. (F) Expression of GATA1-regulated genes highly sensitive to TAL1 complex disruption was validated by RT-qPCR, normalized to β-actin, and plotted as fold change from uninfected samples. Error bars denote SEM (n = 3). (G) Anti-GATA1 and anti-LMO2 ChIP in G1E cells expressing wild-type or mutant GATA1 after 24 hours of E2 treatment using primers against genes significantly impaired in response to R216Q and D218G mutations. LMO2 ChIP signals were normalized to GATA1 ChIP signals at each site. Error bars denote SEM (n = 3).

References

    1. Fujiwara Y, Browne CP, Cunniff K, Goff SC, Orkin SH. Arrested development of embryonic red cell precursors in mouse embryos lacking transcription factor GATA-1. Proc Natl Acad Sci U S A. 1996;93(22):12355–12358. - PMC - PubMed
    1. Shivdasani RA, Fujiwara Y, McDevitt MA, Orkin SH. A lineage-selective knockout establishes the critical role of transcription factor GATA-1 in megakaryocyte growth and platelet development. EMBO J. 1997;16(13):3965–3973. - PMC - PubMed
    1. Ferreira R, Ohneda K, Yamamoto M, Philipsen S. GATA1 function, a paradigm for transcription factors in hematopoiesis. Mol Cell Biol. 2005;25(4):1215–1227. - PMC - PubMed
    1. Martin DI, Orkin SH. Transcriptional activation and DNA binding by the erythroid factor GF-1/NF-E1/Eryf 1. Genes Dev. 1990;4(11):1886–1898. - PubMed
    1. Trainor CD, Omichinski JG, Vandergon TL, Gronenborn AM, Clore GM, Felsenfeld G. A palindromic regulatory site within vertebrate GATA-1 promoters requires both zinc fingers of the GATA-1 DNA-binding domain for high-affinity interaction. Mol Cell Biol. 1996;16(5):2238–2247. - PMC - PubMed

Publication types

MeSH terms