. 2013 Jul 1;73(13):3938-50.
doi: 10.1158/0008-5472.CAN-13-0002. Epub 2013 May 23.

Membrane versus soluble isoforms of TNF-α exert opposing effects on tumor growth and survival of tumor-associated myeloid cells

Affiliations

Membrane versus soluble isoforms of TNF-α exert opposing effects on tumor growth and survival of tumor-associated myeloid cells

Shidrokh Ardestani et al. Cancer Res. .

Erratum in

  • Cancer Res. 2014 Feb 1;74(3):976

Abstract

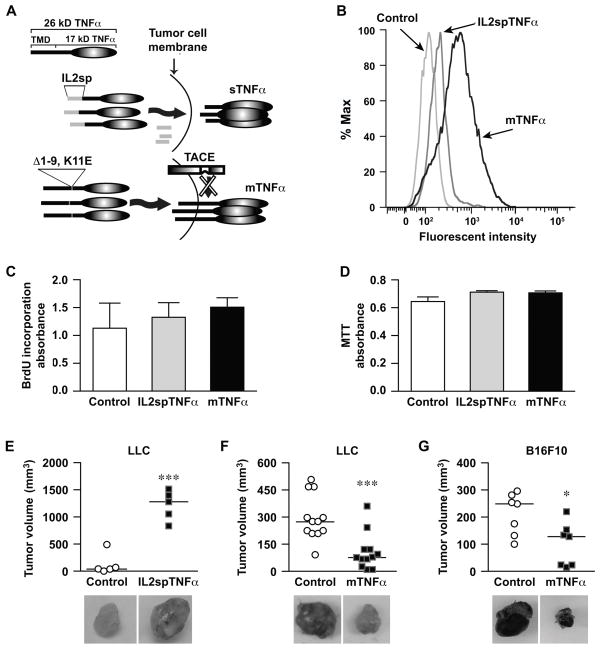
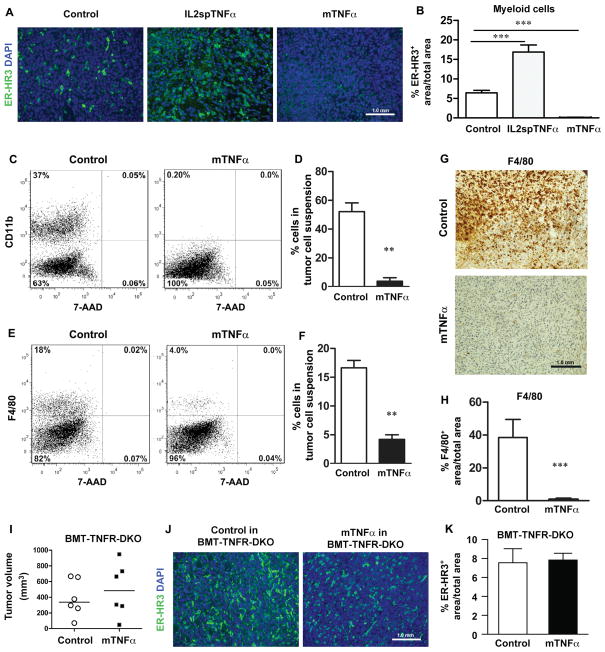
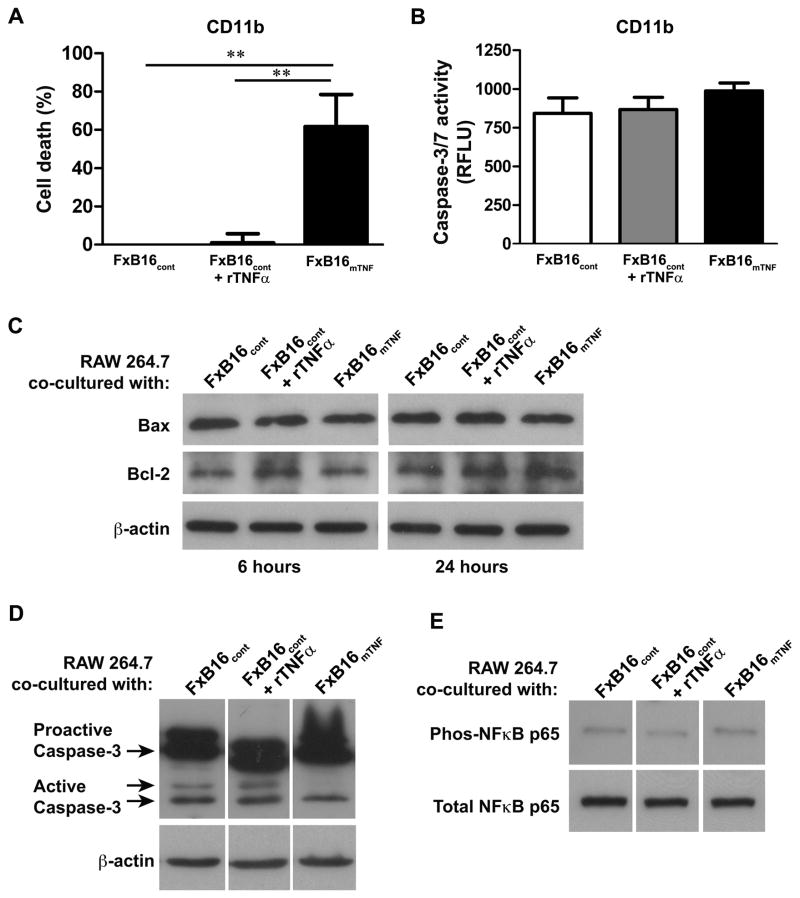
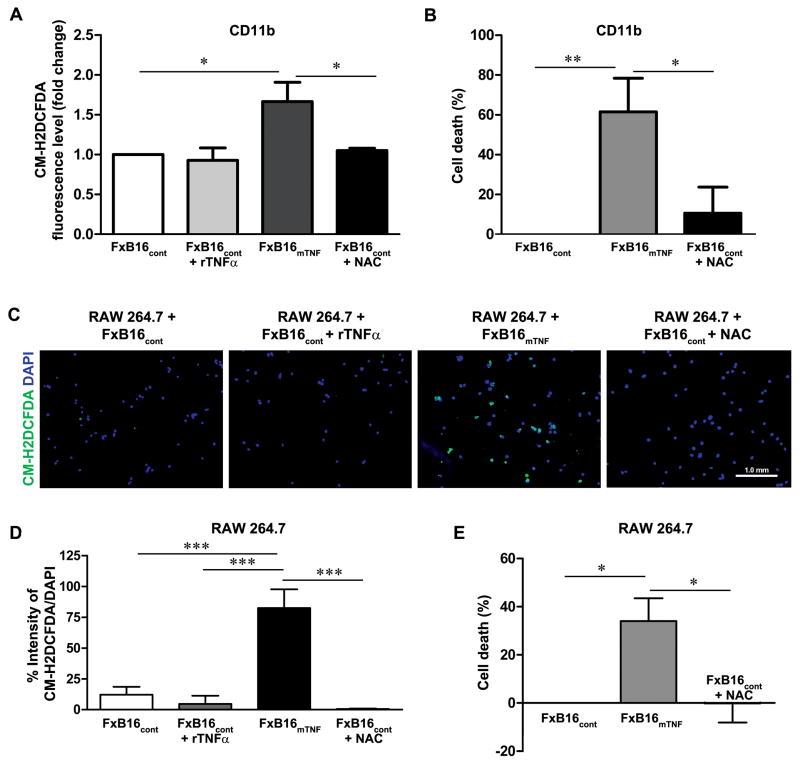
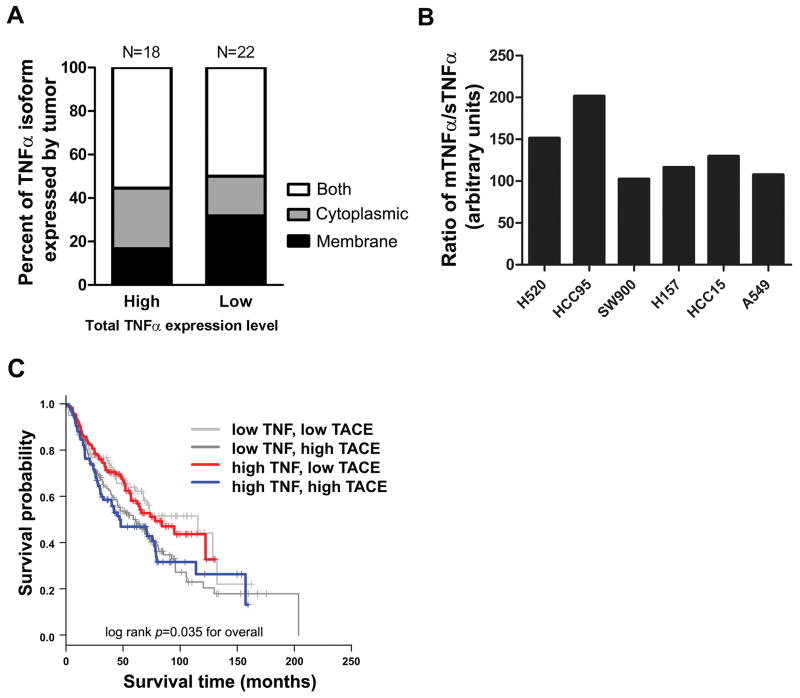
TNF-α, produced by most malignant cells, orchestrates the interplay between malignant cells and myeloid cells, which have been linked to tumor growth and metastasis. Although TNF-α can exist as one of two isoforms, a 26-kDa membrane tethered form (mTNF-α) or a soluble 17-kDa cytokine (sTNF-α), the vast majority of published studies have only investigated the biologic effects of the soluble form. We show for the first time that membrane and soluble isoforms have diametrically opposing effects on both tumor growth and myeloid content. Mouse lung and melanoma tumor lines expressing mTNF-α generated small tumors devoid of monocytes versus respective control lines or lines expressing sTNF-α. The lack of myeloid cells was due to a direct effect of mTNF-α on myeloid survival via induction of cell necrosis by increasing reactive oxygen species. Human non-small cell lung carcinoma expressed varying levels of both soluble and membrane TNF-α, and gene expression patterns favoring mTNF-α were predictive of improved lung cancer survival. These data suggest that there are significant differences in the role of different TNF-α isoforms in tumor progression and the bioavailability of each isoform may distinctly regulate tumor progression. This insight is critical for effective intervention in cancer therapy with the available TNF-α inhibitors, which can block both TNF-α isoforms.


Conflict of interest statement

Conflict of Interest: The authors declare no conflict of interest.

Figures

Figure 1
Figure 1. mTNFα-expressing tumor cells demonstrate delayed tumor growth
(A) Schematic representation of TNFα mutant which has the region coding for the TNFα transmembrane domain (TMD) replaced with region coding for interleukin-2 (IL-2) signal peptide to generate soluble TNFα (sTNFα) and TNFα lacking TACE cleavage site (Δ1–9, K11E) to generate membrane TNFα (mTNFα). (B) Expression of transmembrane TNFα on the surface of LLC tumor cells transduced with empty vector (control), IL2spTNFα or mTNFα vectors was analyzed by flow cytometery. (C and D) Proliferation rate and the viability of transduced tumor cells were determined by BrdU and MTT labeling assays respectively. All cell lines showed no significant difference in proliferation or viability. Data is representative of three independent experiments expressed as the mean±SEM. (E–G) In vivo growth of tumor cells transduced with control vector was compared to LLC lines expressing IL2spTNFα (E), or mTNFα (F), and B16F10 expressing mTNFα (G), by subcutaneous implantation in WT bl/6 mice for 14 days. Each point represents an individual animal and the horizontal bar is the Mean. *P<0.05, ***P<0.0005, Student’s t-test. Photomicrograph of each tumor is shown with each experimental group.
Figure 2
Figure 2. Expression of mTNFα does not affect tumor proliferation or vascularity in vivo
(A) Representative sections of LLC tumors transduced with control, IL2spTNFα and mTNFα constructs were analyzed by immunohistochemistry for PECAM-1 or Ki-67 staining to define vascularity or proliferation, respectively. (B and C) Percentage of PECAM-1-positive (B) or Ki-67-positive area (C) in control, IL2spTNFα and mTNFα in LLC tumors was quantitated. There was no significant difference between the cohorts for either PECAM-1-positive or Ki-67-positive cells (P>0.05), 1-way ANOVA with Tukey’s post-test.
Figure 3
Figure 3. mTNFα-expressing tumors are devoid of tumor-associated myeloid cells
(A) ER-HR3 staining of LLC tumor cells, expressing various TNFα isoforms. Control (left), IL2spTNFα (middle), and mTNFα (right) LLC tumor sections from wild-type bl/6 were stained with ER-HR3 myeloid markers (green). (B) Percentage of ER-HR3-positive cells in LLC tumors transduced with control or different of TNFα isoforms was quantitated. There was a significant decrease in the number of ER-HR3-positive cells in LLC tumors expressing mTNFα isoform compared to control tumors. (C and E) Representative flow cytometric analysis of CD11b- and F4/80-postitive population in LLC tumor cell suspension. Dot plots show CD11b/7-AAD (C) and F4/80/7-AAD (E) from one representative animal for each group. (D and F) Percentage of CD11b- and F4/80-positive cells were quantitated in control and mTNFα tumor cell suspensions. (G) Representative sections of control and mTNFα-transfected LLC tumors were analyzed by immunohistochemistry for F4/80+ macrophages. (H) Number of F4/80-postivie cells in control and mTNFα in LLC tumors was quantitated. (I) Control and mTNFα-expressing LLC tumor cells were implanted subcutaneously in WT bl/6 mice received bone marrow (BM) transplant from TNFα receptors1/2 knockout donor (BMT-TNFR-DKO mice) for 14 days. The mean is shown for each group (n=6 animals). (J) Representative ER-HR3 immunofluorescence staining from control and mTNFα-transduced tumors. (K) Percentage of ER-HR3-positive cells in control and mTNFα-expressing LLC tumors from WT mice with BMT from DRKO donor was quantitated. There was no significant difference between the cohorts for ER-HR3-positive cells (n=3). Data are presented as mean±SEM, **P<0.005, ***P<0.0005; Student’s t-test.
Figure 4
Figure 4. Soluble factors derived from mTNFα do not affect the rate of CD11b+ myeloid cell migration compared to control
(A and B) Transwell migration assay of primary CD11b+ cells treated with conditioned media derived from LLC tumor cells transduced with control/mTNFα (A) or cotnrol/IL2spTNFα (B) constructs. Data presents the mean±SEM. (C) Representative flow cytometric analysis of CFSE-positive cells presented in LLC tumor suspension expressing either control (left) or mTNFα (right) isoform. (D) Quantification of CFSE-positive cells detected in a given number of tumor suspension (n=3 for each tumor type). Data are presented as mean±SEM, P>0.05.
Figure 5
Figure 5. mTNFα induces cell death through apoptosis-independent pathway
(A) Cytotoxic effect of sTNFα and mTNFα on CD11b+ cells measured by MTT assay. (B) Caspase-3/7 activity in CD11b+ cocultured with Paraformaldehyde-fixed control (FxB16cont), control+rTNFα (FxB16cont+TNFα), or mTNFα (FxB16mTNF). (C–E) Kinetics of Bax/Bcl-2, caspase-3 and NF-κB activation in RAW 264.7 after incubation with cancer cells transduced with various TNFα constructs. FxB16cont, FxB16cont+TNFα, or FxB16mTNF was added for indicated incubation period. RAW 264.7 cells were harvested and total cellular protein was analyzed for Bax/Bcl-2 ratio (C), activated caspase-3 (D), and total and phopho- NF-κB p65 (E). Immunoblot analysis showed no differences in Bax/Bcl-2 ratio or caspase-3 and NF-κB pathway activation with different TNFα isoforms compared to control. **P<0.05, 1-way ANOVA with Tukey’s post-test.
Figure 6
Figure 6. mTNFα-induced cell death occurs through induction of ROS
(A) Effects of various TNFα isoforms on intracellular ROS generation in CD11b+ cells. Cells were labeled with ROS detection reagent, CM-H2DCFDA, and incubated with FxB16cont, FxB16cont+TNFα, or FxB16mTNF, FxB16mTNF+N-acetyl-cysteine (NAC, 2mM) and then ROS level was quantitatively analyzed. (B) Cytotoxic effect of mTNFα on CD11b+ cells decreased in the presence of ROS scavenger NAC. (C) Fluorescent micrographs of RAW 264.7 (blue: DAPI nuclear staining) incubated for 8 hours with FxB16cont, FxB16cont+TNFα, or FxB16mTNF, FxB16mTNF+NAC (2mM) and subsequently treated with ROS detection reagent, CM-H2DCFDA (green). (D) Intensity of CM-H2DCFDA was quantitated. Increase in number of ROS generating cell was detected in RAW 264.7 cocultured with mTNFα-expressing B16F10 cells which was reversed by addition of NAC. (E) Cytotoxic effect of mTNFα on RAW 264.7. *P<0.05, **P<0.005 and ***P<0.0005, 1-way ANOVA with Tukey’s post-test.
Figure 7
Figure 7. Relative expression pattern of TNFα/TACE correlates with survival probability in lung cancer patients
(A) Analysis of TNFα expression from 40 human non-small cell lung carcinoma (NSCLC) tissue array. Graph displays the distribution of both degree and localization of TNFα staining 40 NSCLC patient samples. (B) Expression pattern of sTNFα and mTNFα in human NSCLC cell lines measured by ELISA and immunoblotting methods, respectively. A significant variation was observed in the ratio of mTNFα to sTNFα expressed by each cell line. (C) Association between TNFα and TACE co-expression pattern and survival probability in patients with NSCLC. Analysis of the publicly available data from the Shedden cohort (17) was used to correlate TNFα/TACE expression pattern with survival probability (n=442, log rank P=0.035).

References

    1. Bozcuk H, Uslu G, Samur M, et al. Tumour necrosis factor-alpha, interleukin-6, and fasting serum insulin correlate with clinical outcome in metastatic breast cancer patients treated with chemotherapy. Cytokine. 2004;27:58–65. - PubMed
    1. Ferrajoli A, Keating MJ, Manshouri T, et al. The clinical significance of tumor necrosis factor-alpha plasma level in patients having chronic lymphocytic leukemia. Blood. 2002;100:1215–9. - PubMed
    1. Michalaki V, Syrigos K, Charles P, Waxman J. Serum levels of IL-6 and TNF-alpha correlate with clinicopathological features and patient survival in patients with prostate cancer. Br J Cancer. 2004;90:2312–6. - PMC - PubMed
    1. Pfitzenmaier J, Vessella R, Higano CS, Noteboom JL, Wallace D, Jr, Corey E. Elevation of cytokine levels in cachectic patients with prostate carcinoma. Cancer. 2003;97:1211–6. - PubMed
    1. Yoshida N, Ikemoto S, Narita K, et al. Interleukin-6, tumour necrosis factor alpha and interleukin-1beta in patients with renal cell carcinoma. Br J Cancer. 2002;86:1396–400. - PMC - PubMed

Publication types

MeSH terms