. 2013 May 24;340(6135):1237874.
doi: 10.1126/science.1237874.

Cytomegalovirus vectors violate CD8+ T cell epitope recognition paradigms

Affiliations

Cytomegalovirus vectors violate CD8+ T cell epitope recognition paradigms

Scott G Hansen et al. Science. .

Abstract

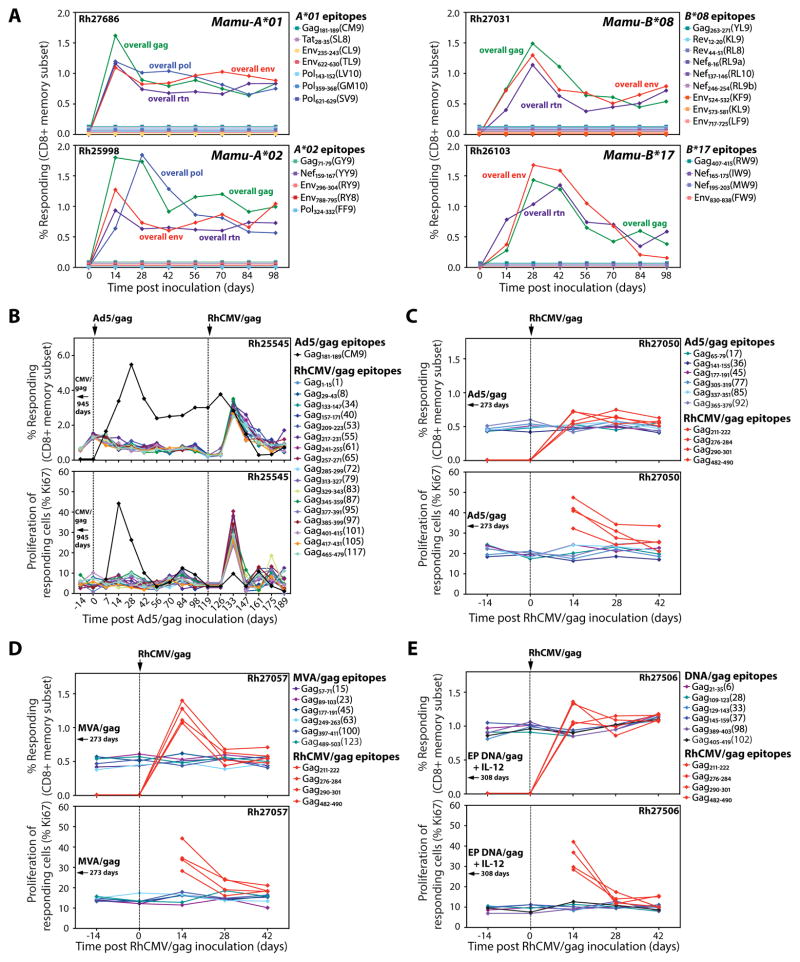
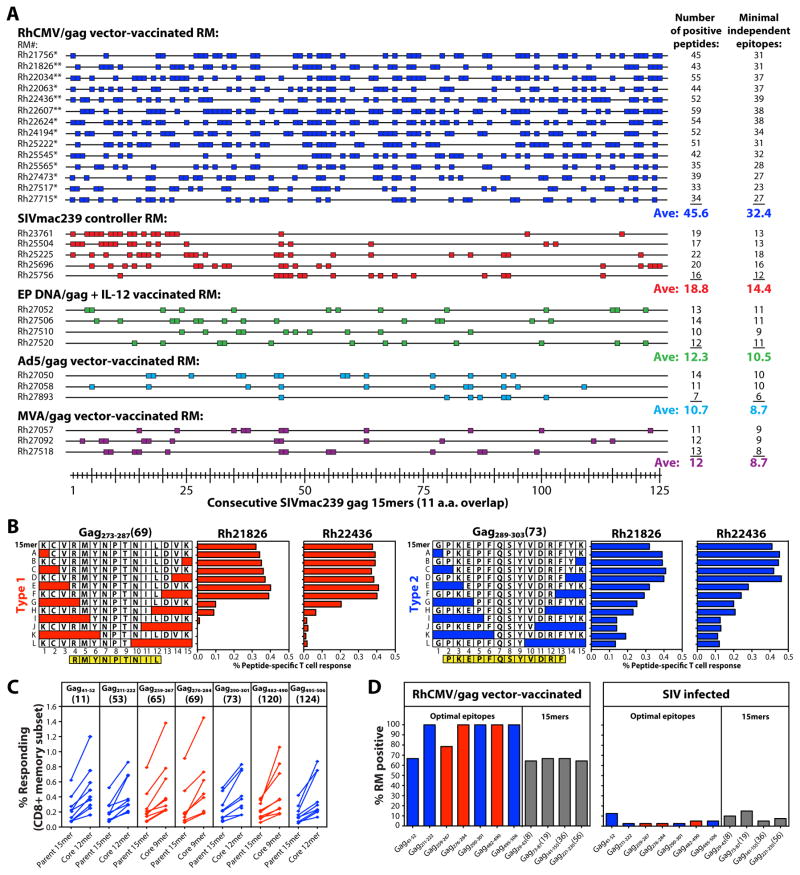
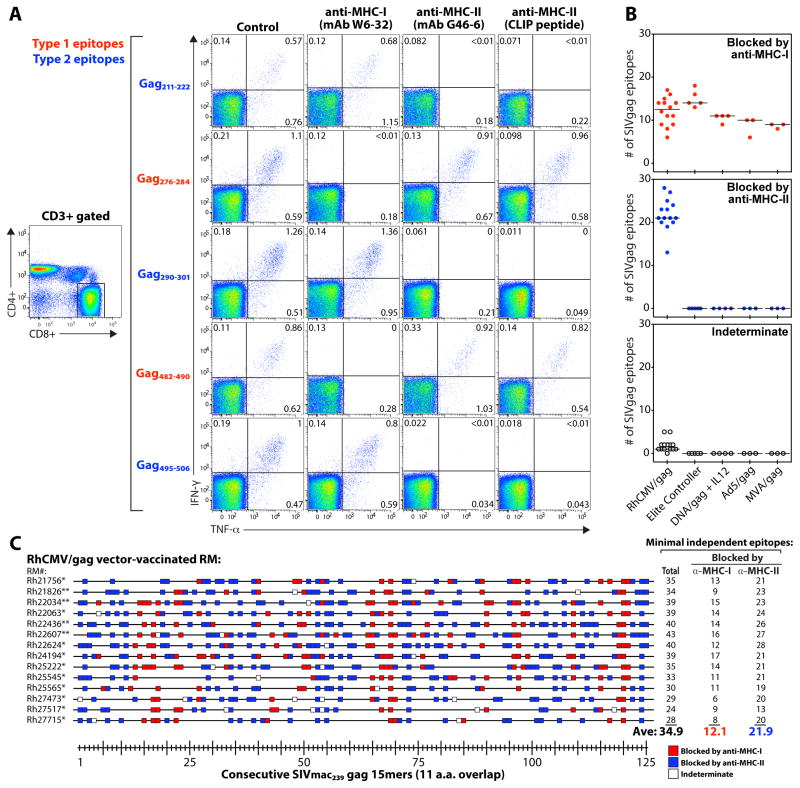
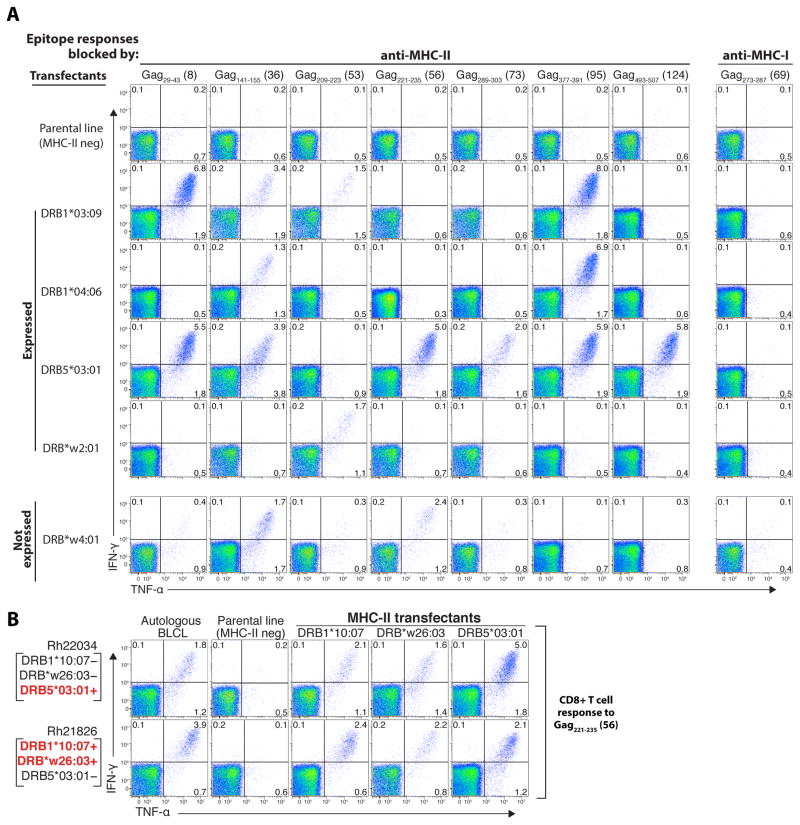
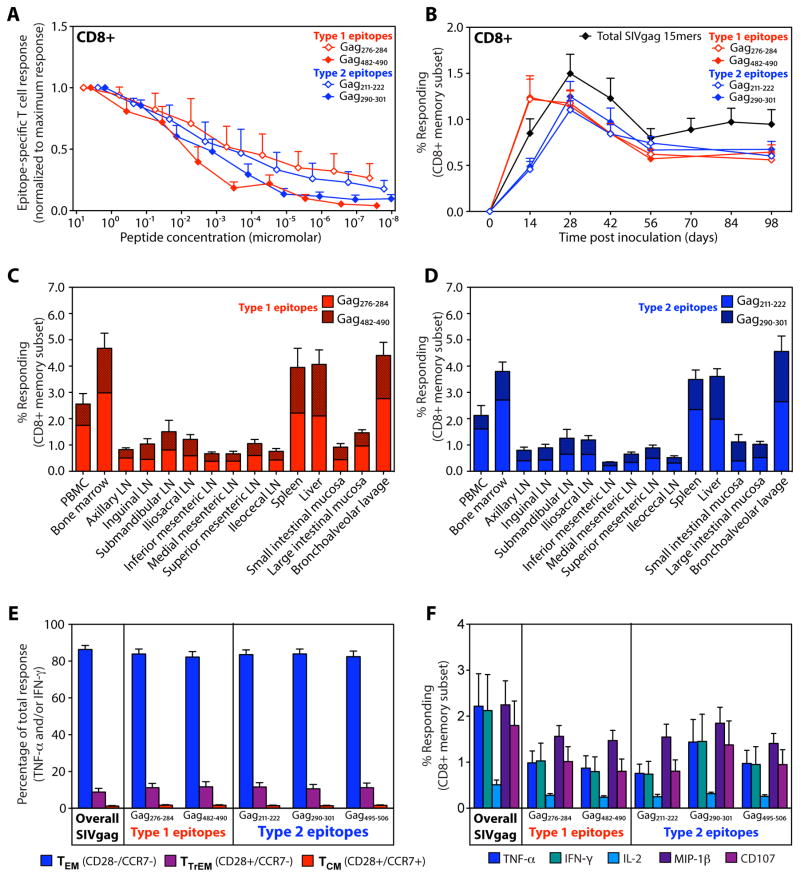
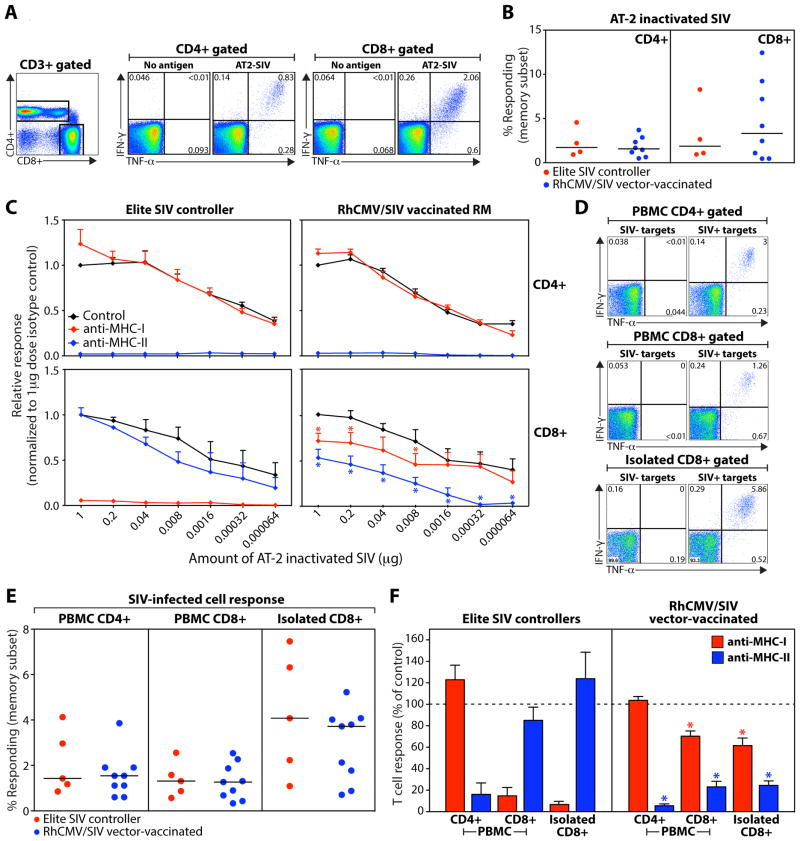
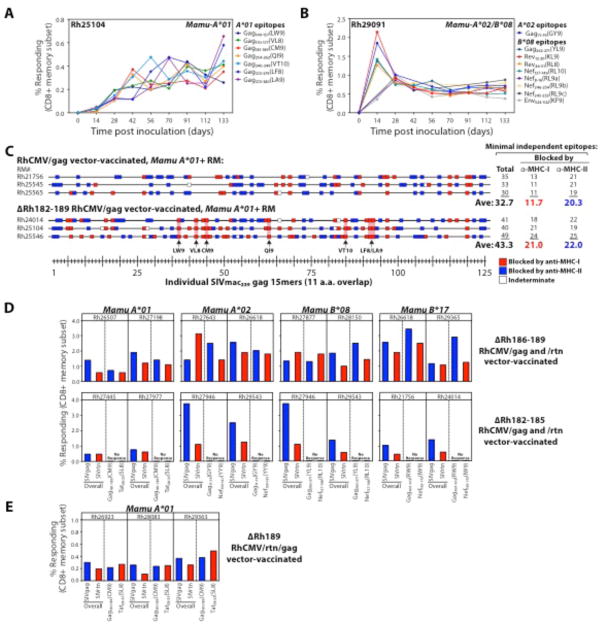
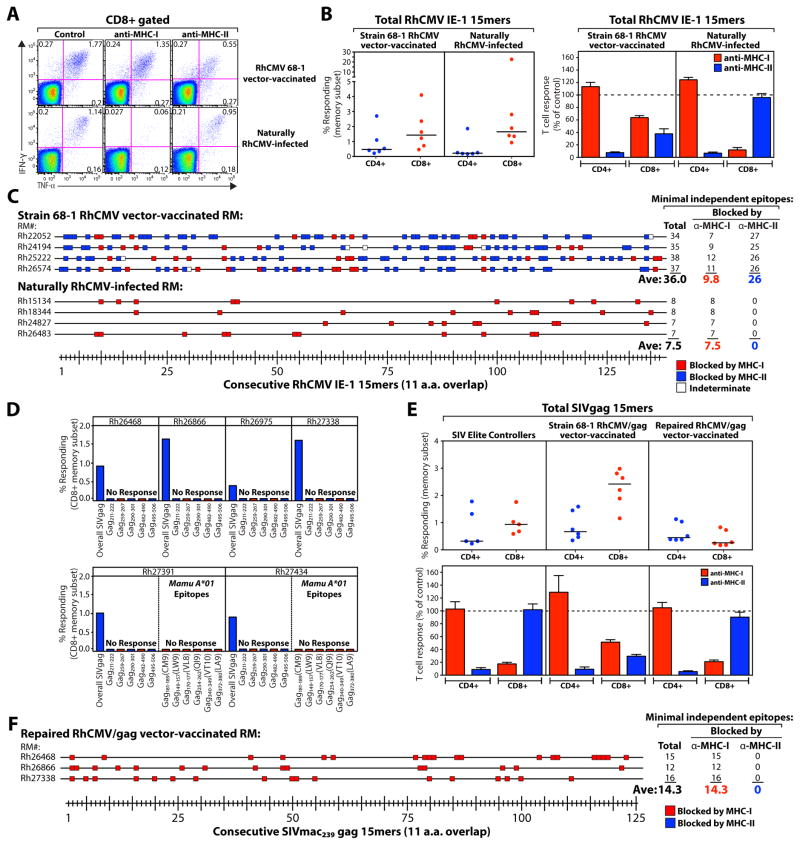
CD8(+) T cell responses focus on a small fraction of pathogen- or vaccine-encoded peptides, and for some pathogens, these restricted recognition hierarchies limit the effectiveness of antipathogen immunity. We found that simian immunodeficiency virus (SIV) protein-expressing rhesus cytomegalovirus (RhCMV) vectors elicit SIV-specific CD8(+) T cells that recognize unusual, diverse, and highly promiscuous epitopes, including dominant responses to epitopes restricted by class II major histocompatibility complex (MHC) molecules. Induction of canonical SIV epitope-specific CD8(+) T cell responses is suppressed by the RhCMV-encoded Rh189 gene (corresponding to human CMV US11), and the promiscuous MHC class I- and class II-restricted CD8(+) T cell responses occur only in the absence of the Rh157.5, Rh157.4, and Rh157.6 (human CMV UL128, UL130, and UL131) genes. Thus, CMV vectors can be genetically programmed to achieve distinct patterns of CD8(+) T cell epitope recognition.


Figures

Fig. 1
Fig. 1
Lack of epitope overlap between RhCMV vector-elicited and conventional SIV-specific CD8+ T cell responses. (A) Flow cytometric ICS was used to follow the development of overall SIV insert- and canonical epitope-specific CD8+ T cell responses (responder = TNF-α + and/or IFN-γ +) in the blood of 4 RM, each with a different well characterized MHC-I allele (Mamu-A*01, -A*02, -B*08 and -B*17), after vaccination with strain 68-1 RhCMV/SIVgag, rev/tat/nef (rtn), env, and pol vectors. No response above background was observed for any canonical epitope. (B) The CD8+ T cell response to individual SIVgag 15mer peptides and the canonical Gag181-189 (CM9) epitope was determined in a long-term strain 68-1 RhCMV/gag-vaccinated, Mamu-A*01+ RM (Rh25545) using flow cytometric ICS. The frequency of these responses in blood and the proliferative status of the responding cells (as measured by Ki-67 expression on TNF-α + and/or IFN-γ + events) were followed after boosting with Ad5/gag, and then 119 days later, after re-vaccination with strain 68-1 RhCMV/gag. Gag181-189 (CM9)-specific responses were not detected prior to administration of Ad5/gag. (C–E) The CD8+ T cell response to individual SIVgag 15mer peptides was determined in RM vaccinated with Ad5/gag (C, Rh27050), MVA/gag (D, Rh27057), and electroporated DNA/gag + IL-12 (E, Rh27506), and these responses were followed after vaccination with strain 68-1 RhCMV/gag as described in B. These figures also show induction of 4 SIVgag 15mer-specific CD8+ T cell responses after RhCMV/gag vaccination that were not detectable in the pre-existing SIVgag-specific responses elicited by the conventional vaccines.
Fig. 2
Fig. 2
RhCMV vector-elicited and conventional SIVgag-specific CD8+ T cell responses differ in epitope breadth and promiscuity. (A) CD8+ T cell responses to SIVgag were epitope-mapped using flow cytometric ICS to detect recognition of 125 consecutive 15mer gag peptides (with an 11 amino acid overlap) in RM vaccinated with strain 68-1 RhCMV/gag vectors [*BAC-derived RhCMV/gag; **non-BAC-derived RhCMV/gag(L); n = 14], electroporated DNA/gag + IL-12 vectors (n = 4), Ad5/gag vectors (n = 3), and MVA/gag vectors (n = 3) and in SIV+ RM with controlled infection (n = 5). Peptides resulting in above background CD8+ T cell responses are indicated by a colored box, with the total number of these positive responses and the minimal number of independent epitopes potentially contained within these reactive peptides in each RM designated at right. p < .0001, epitope breadth of RhCMV/gag-vaccinated RM compared to RM pooled over the other groups, using two-tailed Wilcoxon rank sum tests. (B) The core epitopes of selected 15mer peptides targeted by CD8+ T cells from strain 68-1 RhCMV/gag-vaccinated RM were determined by flow cytometric ICS analysis of CD8+ T cell responses to the indicated truncated peptides. The figure shows representative examples of the 2 response patterns observed with truncated peptide sets: Type 1 (red), with abrupt loss of peak responsiveness and a 9mer core epitope, and Type 2 (blue), with gradual loss of peak responsiveness and a 12mer core epitope (see also fig. S4). (C) CD8+ T cell response frequencies to the parent 15mer peptides and the core peptides derived from these 15mers (Type 1, red; Type 2, blue) were compared by flow cytometric ICS in 9 RM for each response. (D) CD8+ T cell responses to selected SIVgag core epitopes (Type 1, red; Type 2, blue), as well as selected additional SIVgag 15mers (gray), were evaluated by flow cytometric ICS in 42 strain 68-1 RhCMV/gag vector-vaccinated RM (left panel) and 40 SIV-infected RM (right panel) with the % of RM in each category with detectable responses to these peptides shown in the figure.
Fig. 3
Fig. 3
Most RhCMV vector-elicited CD8+ T cell responses are inhibited by MHC-II blockade. (A) PBMC from a representative strain 68-1 RhCMV/gag-vaccinated RM (of 8 RM similarly analyzed RM, see fig. S5) were stimulated with the designated SIVgag core epitopes (Type 1 vs. Type 2) in the presence of irrelevant isotype control mAbs (IgG1 − clone X40 + IgG2a − clone X39; 10μg each), an anti-MHC-I mAb (W6-32; 10μg), an anti-MHC-II mAb (G46-6; 10μg), or the CLIP peptide (MHC-II-associated invariant chain, amino acids 89-100; 2μg). A typical CD4 vs. CD8 expression profile, showing events gated on CD3+ small lymphocytes, is illustrated on the left, with the CD8 gate used to analyze the CD8+ T cell responses indicated. The IFN-γ vs. TNF-α profiles (right panels) include only events collected through these gates, and thus reflect CD8hi/CD4negative T cells. (B,C) All the SIVgag 15mer peptide responses shown in Fig. 2A were subjected to MHC-I (mAb W6-32) vs. MHC-II (mAb G46-6) blockade and classified as being specifically inhibited (blocked) by anti-MHC-I vs. anti-MHC-II mAbs, or indeterminate. (B) For each RM, the average number of peptide-specific responses in each category are shown, classified by vaccine type. (C) The sensitivity of each SIVgag peptide response in 14 strain 68-1 RhCMV/gag-vaccinated RM [*BAC-derived RhCMV/gag; **non-BAC-derived RhCMV/gag(L)] to blockade by anti-MHC-I (red boxes) vs. anti-MHC-II (blue boxes) mAbs is shown (open boxes indicate indeterminate), with the minimal number of independent epitopes in the MHC-I- and MHC-II-associated categories designated at right (note: the total number of independent epitopes increased in some RM from that listed in Fig. 2A due to increased resolution afforded by the MHC blocking data).
Fig. 4
Fig. 4
Multiple MHC-II allomorphs can present type 2 epitopes to RhCMV/gag vector-elicited CD8+ T cells. (A) PBMC from a strain 68-1 RhCMV/gag-vaccinated RM (Rh22034) were incubated with SIVgag peptide-pulsed (and washed) RM3 cells (the MHC-II negative parental cell line) vs. RM3 transfectants expressing single Mamu-DR molecules, and then evaluated for peptide-specific CD8+ T cell recognition using flow cytometric ICS to detect induction of IFN-γ and/or TNF-α production (response frequencies are indicated in each quadrant). The Mamu-DR molecules tested included four that are expressed by Rh22034 (DRB1*0309, DRB1*0406, DRB5*0301, and DRB*w201), and one that is not expressed (DRB*w4:01). The SIVgag 15mer peptides tested corresponded to known MHC-II-blocked CD8+ T cell epitopes (Type 2) in this RM, except for Gag273-287 (15mer #69), which was MHC-I-blocked (Type 1), and therefore used as a negative control. (B) Similar analysis of the presentation of the MHC-II-blocked (Type 2) Gag221-235 (15mer #56) peptide to CD8+ T cells from two strain 68-1 RhCMV/gag vector-vaccinated RM (Rh22034 and Rh21836) by autologous B-lymphoblastoid cells, MHC-II null parental cells and single MHC-II transfectants corresponding to Mamu-DRB alleles that are reciprocally expressed by these 2 RM (expressed alleles denoted in red, non-expressed in black).
Fig. 5
Fig. 5
RhCMV/gag vector-elicited CD8+ T cells show similar function regardless of MHC-I vs. MHC-II restriction. (A) Serial log10 dilutions of 4 core (optimal) SIVgag supertope peptides (2 each MHC-I- and MHC-II-restricted) were used to stimulate PBMC from strain 68-1 RhCMV/gag-vaccinated RM (n = 5) and the response to each peptide dilution was determined by flow cytometric ICS. The frequency of responding CD8+ T cells (TNF-α+ and/or IFN-γ +) at each dilution was normalized to the maximal response at the initial peptide concentration. The figure shows the mean + SEM of the normalized responses for each epitope. (B) Peripheral blood CD8+ T cell responses to total SIVgag 15mer mixes and to 4 core (optimal) SIVgag supertope peptides (2 each MHC-I- and MHC-II-restricted) were quantified by flow cytometric ICS (TNF-α + and/or IFN-γ +) following strain 68-1 RhCMV/gag vaccination (mean + SEM; n = 24) to demonstrate the relative kinetics of induction of the MHC-1 vs. MHC-II-restricted supertope responses. (C,D) CD8+ T cell responses to 2 MHC-I-restricted (C) and 2 MHC-II-restricted (D) core (optimal) SIVgag supertope peptides were quantified by flow cytometric ICS (TNF-α + and/or IFN-γ +) in mononuclear cell preparations from the indicated tissues at necropsy of strain 68-1 RhCMV/gag vector-vaccinated RM (mean + SEM; n = 4). (E) PBMC from strain 68-1 RhCMV/gag-vaccinated RM (n =14) were stimulated with total SIVgag 15mer mixes or the MHC-I- vs. MHC-II-restricted core (optimal) SIVgag supertope peptides shown and the expression of CD28 vs. CCR7 was determined on the responding cells (TNF-α + and/or IFN-γ +) by flow cytometric ICS, allowing delineation of the mean (+ SEM) proportion of the responding cells manifesting the designated central memory (TCM), transitional effector memory (TTrEM) and effector memory (TEM) phenotypes. (F) PBMC from strain 68-1 RhCMV/gag-vaccinated RM (n =14) were stimulated with total SIVgag 15mer mixes or the MHC-I- vs. MHC-II-restricted core (optimal) SIVgag supertope peptides shown and the frequencies of cells within the CD8+ memory compartment producing each cytokine or showing CD107 externalization were determined. The figure shows the mean (+ SEM) of these response frequencies after background subtraction.
Fig. 6
Fig. 6
RhCMV vector-elicited CD8+ T cells recognize SIV-infected cells via both MHC-I and MHC-II antigen presentation. (A) Representative flow cytometric profiles of CD4+ and CD8+ T cells in PBMC from an RM vaccinated with strain 68-1 RhCMV/SIV vectors responding to 1 μg (p27CA equivalent) of AT-2 SIV vs. no antigen (quadrant response frequencies indicated). (B) Comparison of AT-2 SIV-specific response frequencies in the CD4+ or CD8+ memory compartment in the blood of SIV+ elite controllers (n = 4) vs. RM vaccinated with strain 68-1 RhCMV/SIV vectors (n = 8). (C) Serial 5-fold dilutions of AT-2 SIV were used to stimulate PBMC from the same strain 68-1 RhCMV/SIV-vaccinated and SIV+ elite controllers shown in panel B, comparing the CD4+ and CD8+ T cell response frequencies in the presence of isotype control mAb vs. MHC-1 blocking mAb W6-32 vs. the MHC-II-blocking CLIP peptide (see Fig. 3). The response frequencies of each subset in each RM were normalized to the unblocked response frequencies at the highest AT-2 SIV dose and the mean + SEM of these normalized response frequencies are shown for each treatment and dose. Asterisks indicate the MHC-I- or MHC-II-blocked CD8+ T cell responses, as fractions of the isotype responses at the same dilution, that are significantly different (p < .05) from 1.0 using a two-tailed Wilcoxon signed rank test (RhCMV/SIV vector group only; see fig. S8). (D) Representative flow cytometric profiles of CD4+ and CD8+ T cells in PBMC and isolated CD8+ T cells from an RM vaccinated with strain 68-1 RhCMV/SIV vectors responding to autologous SIV-infected CD4+ T cells (SIV+ targets) vs. similarly processed and cultured CD4+ T cells that were not SIV-infected (SIV- targets) using an effector to target ratio of 80:1. (E) Comparison of SIV-infected cell-specific response frequencies in the memory subsets of CD4+ and CD8+ T cells in PBMC and isolated CD8+ T cells from SIV+ elite controllers (n = 5) vs. RM vaccinated with strain 68-1 RhCMV/SIV vectors (n = 9). (F) The sensitivity of the SIV+ cell-specific T cell responses shown in panel E to blocking with the MHC-1-blocking mAb W6-32 vs. the MHC-II blocking CLIP peptide is shown. The response frequencies were normalized to the response frequencies in the isotype control and the mean + SEM of these normalized response frequencies are shown for each treatment. Asterisks indicate the normalized MHC-I- or MHC-II-blocked CD8+ T cell responses that are significantly different (p < .05) from 100% using a two-tailed Wilcoxon signed rank test (RhCMV/SIV vector group only; see fig. S9).
Fig. 7
Fig. 7
Rh189 (US11) gene prevents canonical epitope recognition. (A,B) Flow cytometric ICS was used to follow the development of canonical epitope-specific CD8+ T cell responses in the blood of 2 RM, one expressing Mamu-A*01, the other expressing both Mamu-A*02 and -B*08, after vaccination with strain 68-1-derived RhCMV/SIV vectors in which the Rh182-189 (US2-11) genes were deleted [note: these RM were CMV naïve prior to vaccination, as the Rh182-189-deleted vectors cannot superinfect RhCMV+ RM (12)]. (C) CD8+ T cell responses to SIVgag were epitope-mapped and MHC-blocked (as described in Figs. 2 and 3) in 6 Mamu-A*01-expressing (initially RhCMV-naïve) RM, 3 vaccinated with the unmodified strain 68-1 RhCMV/gag vector and 3 vaccinated with the ΔRh182-189 (ΔUS2-11) version of this vector. Responses blocked by anti-MHC-I- vs. anti-MHC-II are indicated by red and blue boxes, respectively, with the 15mers containing canonical Mamu-A*01-restricted epitopes indicated by pink rectangles. (D) The peak acute phase CD8+ T cell responses in blood to whole SIVgag and SIVrtn peptide mixes and canonical SIVgag, SIVnef, and SIVtat epitopes are shown for (initially RhCMV+) RM expressing the designated MHC-I alleles and vaccinated with SIVgag- and SIVrtn-expressing strain 68-1 RhCMV vectors lacking either Rh186-189 (US8-11) or Rh182-186 (US2-6). (E) The peak acute phase CD8+ T cell responses in blood to whole SIVgag and SIVrtn peptide mixes and canonical SIVgag and SIVtat epitopes are shown for 3 (initially RhCMV+) RM expressing Mamu-A*01 and vaccinated with an SIVgag- and SIVrtn-expressing strain 68-1 RhCMV vector lacking only Rh189 (US11).
Fig. 8
Fig. 8
Unconventional CD8+ T cell targeting is restricted to responses elicited by fibroblast-adapted RhCMV lacking UL128-131 orthologue expression. (A) Representative flow cytometric profiles of CD8+ T cells in PBMC from an unvaccinated, naturally RhCMV-infected RM (colony circulating strain) vs. a strain 68-1 RhCMV/SIV vector-vaccinated RM responding to consecutive 15mer peptides (11 amino acid overlap) comprising the RhCMV IE-1 protein in the presence of isotype control vs. blocking anti-MHC-I vs. blocking anti-MHC-II mAbs. (B) Comparison of the frequency (left panel) and sensitivity to blockade with anti-MHC-I vs. anti-MHC-II mAbs (right panel; mean + SEM) of IE-1-specific CD4+ and CD8+ T cells from naturally RhCMV-infected vs. strain 68-1 RhCMV/SIV vector-vaccinated RM (n = 6 per group; see fig. S12A). (C) CD8+ T cell responses to RhCMV IE-1 in naturally RhCMV-infected and strain 68-1 RhCMV/SIV vector-vaccinated RM (n = 4 each) were epitope-mapped to determine recognition of 137 consecutive 15mer IE-1 peptides and then the MHC association of each response was classified by sensitivity to blockade with anti-MHC-I vs. anti-MHC-II mAbs. (D) The peak, acute phase CD8+ T cell response frequencies in blood to the whole SIVgag 15mer mix, each of the 5 universal RhCMV/gag vector-associated supertopes, and in the 2 Mamu-A*01+ RM (Rh27391 and Rh27434), each of the indicated canonical SIVgag epitopes restricted by this allele, are shown in 6 RM vaccinated with a strain 68-1 RhCMV/gag vector in which expression of RhCMV orthologues of HCMV UL128-131 genes (Rh157.6, 157.4 and 157.5) has been restored. (E) Comparison of the frequency (top panel) and sensitivity to blockade with anti-MHC-I vs. anti-MHC-II mAbs (bottom panel; mean + SEM) of SIVgag-specific CD4+ and CD8+ T cells from SIV+ elite controllers vs. RM vaccinated with the original strain 68-1 RhCMV/SIV vector vs. RM vaccinated with the Rh157.4-.6 (UL128-131)-repaired RhCMV/gag vector (n = 6 per group; see fig. S12B). (F) CD8+ T cell responses to SIVgag in 3 RM vaccinated with the Rh157.4-.6 (UL128-131)-repaired RhCMV/gag vector were epitope-mapped and then the MHC association of each response was classified by sensitivity to blockade with anti-MHC-I vs. anti-MHC-II mAbs (compare to Fig. 3C).

Comment in

References

    1. Neefjes J, Jongsma ML, Paul P, Bakke O. Towards a systems understanding of MHC class I and MHC class II antigen presentation. Nat Rev Immunol. 2011;11:823. - PubMed
    1. Yewdell JW. Confronting complexity: real-world immunodominance in antiviral CD8+ T cell responses. Immunity. 2006;25:533. - PubMed
    1. Irvine K, Bennink J. Factors influencing immunodominance hierarchies in TCD8+-mediated antiviral responses. Expert Rev Clin Immunol. 2006;2:135. - PubMed
    1. Assarsson E, et al. A quantitative analysis of the variables affecting the repertoire of T cell specificities recognized after vaccinia virus infection. J Immunol. 2007;178:7890. - PubMed
    1. Goulder PJ, Watkins DI. Impact of MHC class I diversity on immune control of immunodeficiency virus replication. Nat Rev Immunol. 2008;8:619. - PMC - PubMed

Publication types