

Treatment effects on measures of body composition in the TODAY clinical trial
- PMID: 23704673
- PMCID: PMC3661839
- DOI: 10.2337/dc12-2534
Treatment effects on measures of body composition in the TODAY clinical trial
Abstract
Objective: The Treatment Options for type 2 Diabetes in Adolescents and Youth (TODAY) trial showed superiority of metformin plus rosiglitazone (M+R) over metformin alone (M), with metformin plus lifestyle (M+L) intermediate in maintaining glycemic control. We report here treatment effects on measures of body composition and their relationships to demographic and metabolic variables including glycemia.
Research design and methods: Measures of adiposity (BMI, waist circumference, abdominal height, percent and absolute fat, and bone mineral content [BMC] and density [BMD]) were analyzed as change from baseline at 6 and 24 months.
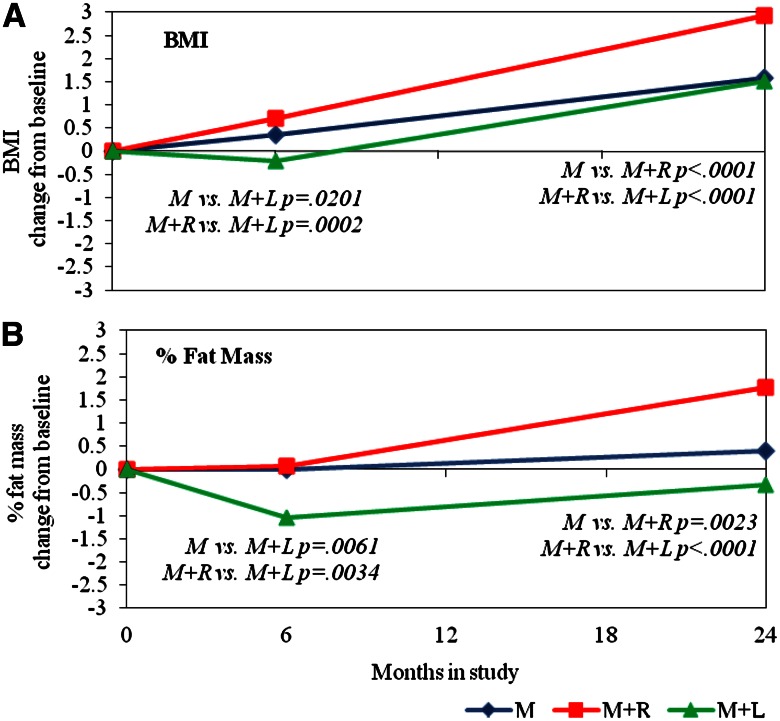
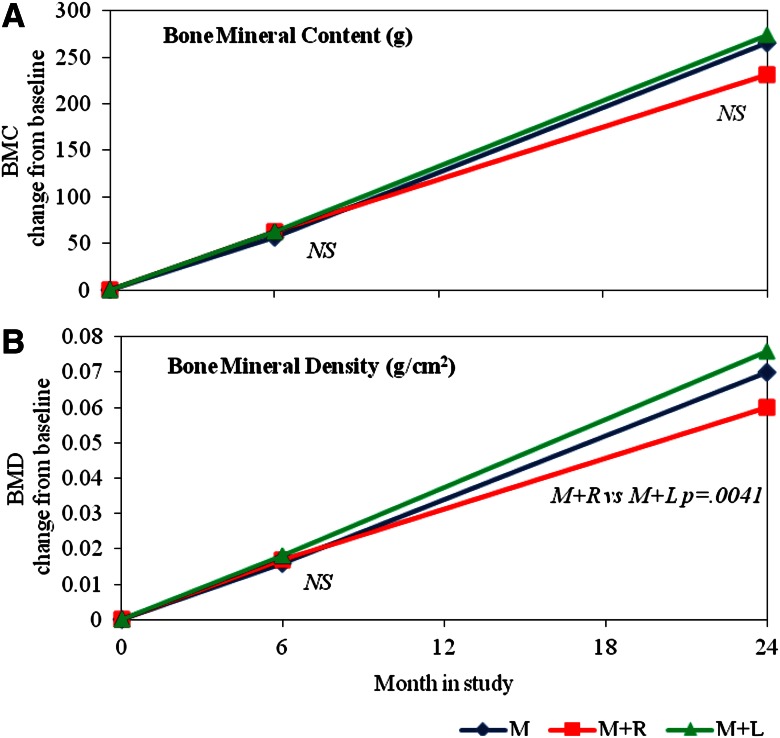
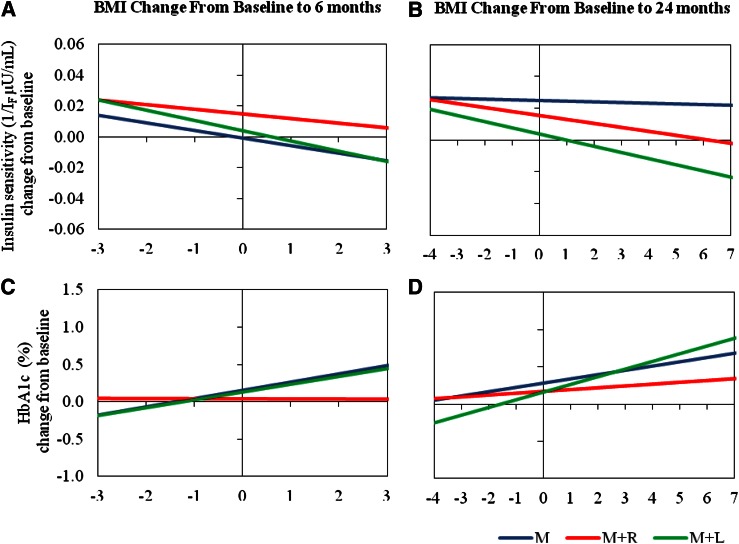
Results: Measures of fat accumulation were greatest in subjects treated with M+R and least in M+L. Although fat measures in M+L were less than those of M+R and M at 6 months, differences from M were no longer apparent at 24 months, whereas differences from M+R persisted at 24 months. The only body composition measure differing by race and/or ethnicity was waist circumference, greater in M+R than either M or M+L at both 6 and 24 months in whites. BMD and BMC increased in all groups, but increased less in M+R compared with the other two groups by 24 months. Measures of adiposity (increases in BMI, waist circumference, abdominal height, and fat) were associated with reduced insulin sensitivity and increased hemoglobin A1c (HbA1c), although effects of adiposity on HbA1c were less evident in those treated with M+R.
Conclusions: Despite differential effects on measures of adiposity (with M+R resulting in the most and M+L in the least fat accumulation), group differences generally were small and unrelated to treatment effects in sustaining glycemic control.
Trial registration: ClinicalTrials.gov NCT00081328.
Figures
References
-
- The Writing Group for the SEARCH for Diabetes in Youth Study Group Incidence of diabetes in youth in the United States. JAMA 2007;297:2716–2724 - PubMed
-
- Zeitler P, Epstein L, Grey M, et al. TODAY Study Group Treatment options for type 2 diabetes in adolescents and youth: a study of the comparative efficacy of metformin alone or in combination with rosiglitazone or lifestyle intervention in adolescents with type 2 diabetes. Pediatr Diabetes 2007;8:74–87 - PMC - PubMed
-
- American Diabetes Association Diagnosis and classification of diabetes mellitus. Diabetes Care 2005;28(Suppl. 1):S37–S42 - PubMed
Publication types
MeSH terms
Substances
Associated data
Grants and funding
- UL1 TR000005/TR/NCATS NIH HHS/United States
- U01-DK-61230/DK/NIDDK NIH HHS/United States
- UL1 RR024153/RR/NCRR NIH HHS/United States
- M01-RR-00084/RR/NCRR NIH HHS/United States
- UL1 RR025780/RR/NCRR NIH HHS/United States
- M01 RR000069/RR/NCRR NIH HHS/United States
- M01 RR000036/RR/NCRR NIH HHS/United States
- U01 DK061242/DK/NIDDK NIH HHS/United States
- UL1 RR024992/RR/NCRR NIH HHS/United States
- UL1-RR-024139/RR/NCRR NIH HHS/United States
- UL1-RR-024989/RR/NCRR NIH HHS/United States
- M01 RR001066/RR/NCRR NIH HHS/United States
- M01 RR014467/RR/NCRR NIH HHS/United States
- U01-DK-61212/DK/NIDDK NIH HHS/United States
- UL1-RR-024992/RR/NCRR NIH HHS/United States
- UL1 TR000448/TR/NCATS NIH HHS/United States
- M01 RR000084/RR/NCRR NIH HHS/United States
- U01-DK-61239/DK/NIDDK NIH HHS/United States
- UL1 RR024139/RR/NCRR NIH HHS/United States
- UL1 RR024989/RR/NCRR NIH HHS/United States
- U01 DK061254/DK/NIDDK NIH HHS/United States
- M01-RR-00036/RR/NCRR NIH HHS/United States
- U01 DK061212/DK/NIDDK NIH HHS/United States
- UL1-RR-024153/RR/NCRR NIH HHS/United States
- U01-DK-61254/DK/NIDDK NIH HHS/United States
- U01 DK061230/DK/NIDDK NIH HHS/United States
- UL1 TR000439/TR/NCATS NIH HHS/United States
- UL1-RR-025758/RR/NCRR NIH HHS/United States
- M01 RR000043/RR/NCRR NIH HHS/United States
- M01-RR-00043-45/RR/NCRR NIH HHS/United States
- UL1-RR-024134/RR/NCRR NIH HHS/United States
- UL1-RR-025780/RR/NCRR NIH HHS/United States
- M01-RR-00069/RR/NCRR NIH HHS/United States
- U01-DK-61242/DK/NIDDK NIH HHS/United States
- UL1 RR025758/RR/NCRR NIH HHS/United States
- M01-RR-00125/RR/NCRR NIH HHS/United States
- M01-RR-01066/RR/NCRR NIH HHS/United States
- M01 RR000125/RR/NCRR NIH HHS/United States
- U01 DK061239/DK/NIDDK NIH HHS/United States
- UL1 RR024134/RR/NCRR NIH HHS/United States
- UL1 TR000130/TR/NCATS NIH HHS/United States
LinkOut - more resources
Full Text Sources
Other Literature Sources
Medical
