. 2013 May 21;8(5):e59558.
doi: 10.1371/journal.pone.0059558. Print 2013.

Glioma initiating cells form a differentiation niche via the induction of extracellular matrices and integrin αV

Affiliations

Glioma initiating cells form a differentiation niche via the induction of extracellular matrices and integrin αV

Akiko Niibori-Nambu et al. PLoS One. .

Abstract

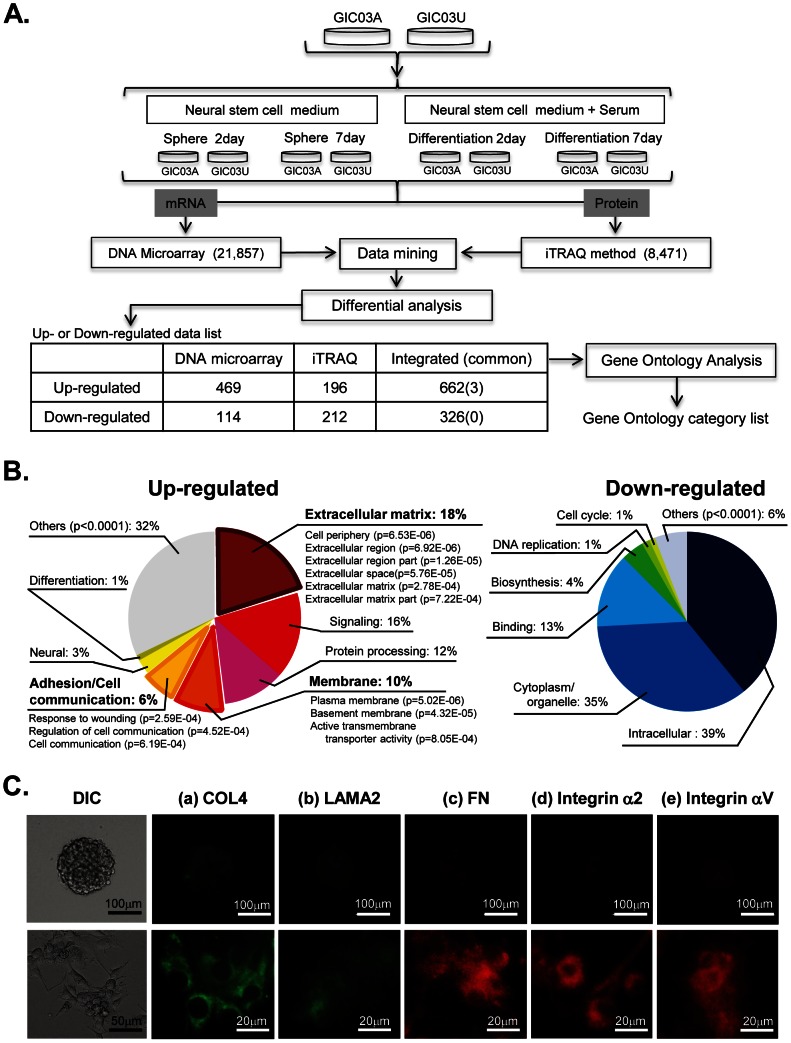
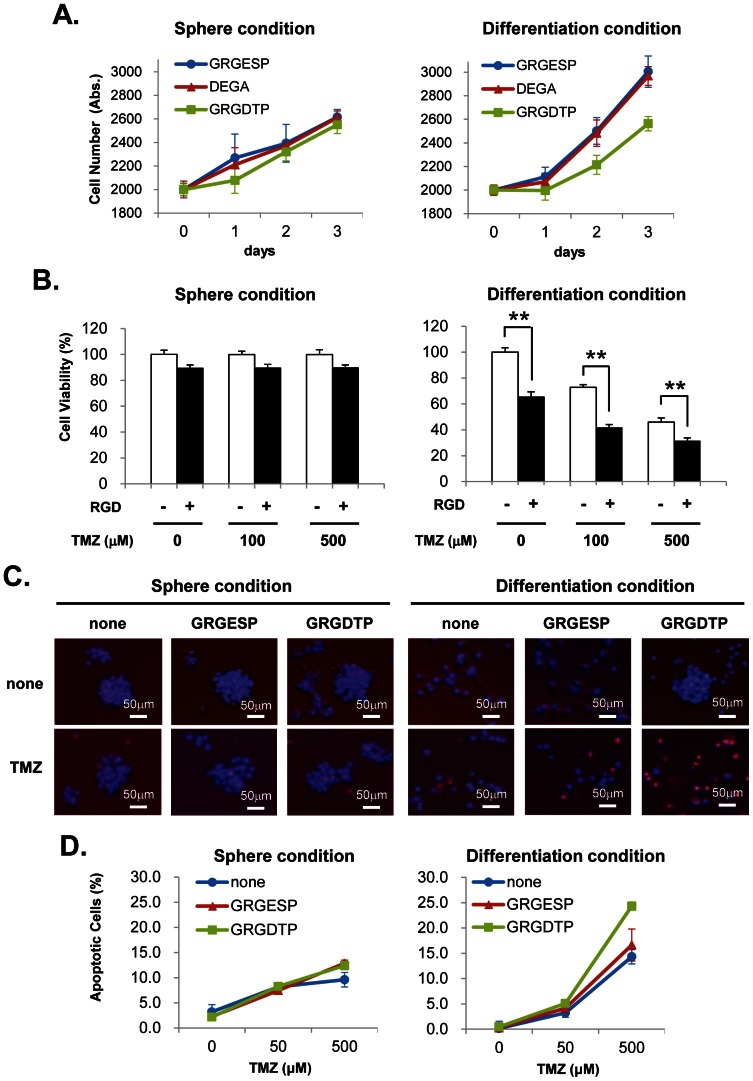
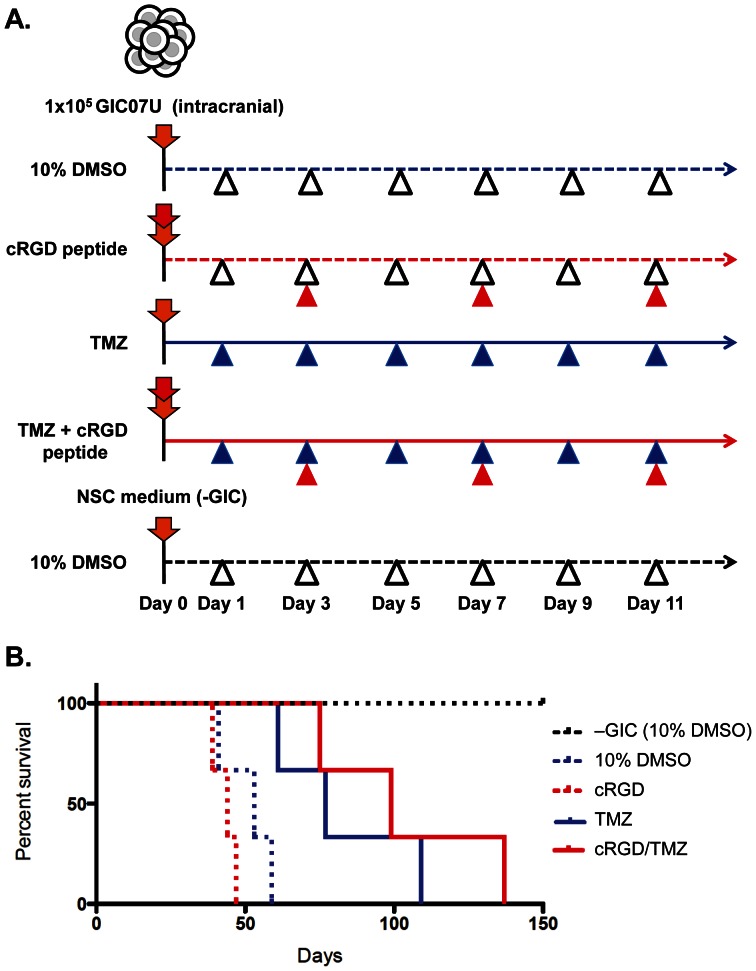
Glioma initiating cells (GICs) are considered responsible for the therapeutic resistance and recurrence of malignant glioma. To clarify the molecular mechanism of GIC maintenance/differentiation, we established GIC clones having the potential to differentiate into malignant gliomas, and subjected to DNA microarray/iTRAQ based integrated proteomics. 21,857 mRNAs and 8,471 proteins were identified and integrated into a gene/protein expression analysis chart. Gene Ontology analysis revealed that the expression of cell adhesion molecules, including integrin subfamilies, such as α2 and αV, and extracellular matrices (ECMs), such as collagen IV (COL4), laminin α2 (LAMA2), and fibronectin 1 (FN), was significantly upregulated during serum-induced GIC differentiation. This differentiation process, accompanied by the upregulation of MAPK as well as glioma specific proteins in GICs, was dramatically accelerated in these ECM (especially FN)-coated dishes. Integrin αV blocking antibody and RGD peptide significantly suppressed early events in GIC differentiation, suggesting that the coupling of ECMs to integrin αV is necessary for GIC differentiation. In addition, the expression of integrin αV and its strong ligand FN was prominently increased in glioblastomas developed from mouse intracranial GIC xenografts. Interestingly, during the initial phase of GIC differentiation, the RGD treatment significantly inhibited GIC proliferation and raised their sensitivity against anti-cancer drug temozolomide (TMZ). We also found that combination treatments of TMZ and RGD inhibit glioma progression and lead the longer survival of mouse intracranial GIC xenograft model. These results indicate that GICs induce/secrete ECMs to develop microenvironments with serum factors, namely differentiation niches that further stimulate GIC differentiation and proliferation via the integrin recognition motif RGD. A combination of RGD treatment with TMZ could have the higher inhibitory potential against the glioma recurrence that may be regulated by the GICs in the differentiation niche. This study provides a new perspective for developing therapeutic strategies against the early onset of GIC-associated glioma.


Conflict of interest statement

Competing Interests: One of the first authors, Uichi Midorikawa, is a Ph.D. student of Graduate School of Medicine, Kumamoto University, entering from the workforce of The Healthcare Systems Laboratories, Sharp Corp. This does not alter the authors' adherence to all the PLOS ONE policies on sharing data and materials.

Figures

Figure 1
Figure 1. Characterization of GICs established from tumors of malignant glioma patients.
A. Histochemical observations of glioblastomas developed from mouse brain GICs xenografts. A representative H&E staining pattern of a glioblastoma derived from a GICs xenograft in NOD/SCID mouse brain (left and center), and immunohistochemistry of a proliferation marker Ki67 (right). B. GIC spheres (a–e, upper photos) or differentiating cells in the presence of 10% FCS (a–e, lower photos) after 7 day's culture in non-coated dishes were immunostained to analyze the expression patterns of the neural marker proteins with specific antibodies as indicated. Secondary antibodies labeled with Alexa 488 (green) and Alexa 546 (red) were used for the detection. C. GIC spheres in the NSC medium or differentiating cells in the presence of 10% FCS after the indicated periods of cultures in non-coated dishes were subjected to the SDS-PAGE followed by the western blotting using anti-CD133, GFAP and CD44 antibodies to compare their expression patterns in both types of GICs. Actin was used for the internal control.
Figure 2
Figure 2. Integrated proteomics, GO analysis and immunocytochemical validation of GICs.
A. A workflow for the identification of the genes regulating GIC differentiation. At first, each GIC sphere was disassociated into single cells, separated into four fractions, and cultured in NSC medium containing growth factors or 10% FCS for 2 days or 7 days. Cells were collected and washed, and mRNA and proteins were simultaneously prepared and subjected to transcriptome and proteome analyses, respectively. mRNA differential analysis using DNA expression arrays quantitatively identified 21,857 expressed genes. Proteome differential analysis using the iTRAQ method identified 8,471 proteins from 564,657 peptides. All the data were integrated into one chart, and used for further GO and functional analyses. B. Pie charts of the highly extracted GO terms functionally grouped as upregulated genes/proteins (left) or as downregulated genes/proteins (right) during GIC differentiation (Table S1). The GO term frequencies of each functional group (p<0.001) among 2,046 and 1,868 terms in up (662)- and down (326)-regulated genes/proteins, respectively, are shown as percentages. C. Validation of the expression of ECMs and integrin families by immunocytochemistry. GIC spheres (a–e, upper panel) or differentiating cells in the presence of 10% FCS (a–e, lower panel) after 7 day's culture in non-coated dishes were immunostained to analyze the expression patterns of the identified proteins upregulated in differentiating GICs.
Figure 3
Figure 3. Adhesion, migration and differentiation of GICs on ECMs via integrin αV.
A. GFAP expressions in GICs cultured on ECM-coated dishes in the presence/absence of FCS for 48 hours was analyzed by western blotting. B. The intensity ratio of GFAP expression analyzed in (A) was quantitated using an actin internal marker. C. GFAP expressions in GICs cultured on ECM-coated dishes in the presence/absence of serum stimulation. The GIC spheres cultured on ECMs (COL4, LAM, FN) or PLL-coated dishes without serum, or on non-coated dishes with/without serum, were analyzed by western blot analysis at 48 hours after seeding. D and E. GIC spheres treated with blocking antibodies against integrin α2 and αV, or with control IgG (D), or with integrin-binding peptide DGEA, GRGDTP, or control peptide GRGESP (E) were stimulated by serum in non-coated dish. The representative stack photographs of the sphere at 0 hour and after 24 hours of FCS stimulation are shown. F. GFAP expression in GICs treated under the same conditions as in (D) and (E) for 48 hours was analyzed by western blotting. G. The intensity-ratio of the GFAP expression of GICs analyzed in (F) was quantitated. The values shown in (C) and (G) are means ±S.E of three independent experiments run in duplicate. *p<0.05 and **p<0.01. H. Effects of integrin blocking antibodies on GICs adhesion/migration on ECM-coated dishes. GIC spheres were treated with blocking antibodies against integrin αV or control IgG for 30 min before seeding onto ECM-coated dishes. Cell morphologies were analyzed by time-lapse microscopy. Representative stack photographs taken at 0 and 12 hours are shown. I. Effects of integrin-binding peptides on GICs adhesion/migration on ECM-coated dishes. GIC spheres were treated with integrin-binding GRGDTP, or control (GRGESP) peptides for 30 min before seeding into ECM-coated dishes. Cell morphologies were analyzed by time-lapse microscopy, and shown by the representative stack photographs at 0 and 12 hours.
Figure 4
Figure 4. Fibronectin/integrin αV expression in glioblastomas developed from mouse brain GIC xenografts and differentiating GIC clones.
A. HE staining and immunohistochemical staining with anti-FN and -integrin αV antibodies of serial sections of a glioblastoma derived from a mouse brain GIC xenograft. The representative tissues were obtained from a glioblastoma in the brain at 39 days after the intracranial injection of GIC07U. B. Differentiating GIC03A, GIC03U and GIC07U were stained with anti-FN antibody (green, upper panel), DAPI (blue; upper panel), anti-integrin αV antibody (red; lower panel) and DAPI (purple; lower panel) after 5 day's serum stimulation. All of GIC clones possess cytoplasmic expression of FN and membrane expression of integrin αV.
Figure 5
Figure 5. Treatment of RGD peptide and TMZ decreases cellular viability of GICs during serum-induced differentiation.
A. GIC spheres or serum induced differentiating GICs were treated with GRGESP as control (blue), and RGDTP (green) or DGEA peptide (red) as integrin-binding peptide for 3 days, and their cellular viabilities were analyzed with WST-8 assay. B. GIC spheres or serum induced differentiating GICs were treated with TMZ (0, 100, 500 µM) and/or RGD peptide for 3 days, and analyzed by WST-8 assay. The values shown in (A) and (B) are means ±S.E of three independent experiments. **p<0.01. C. Representative morphological changes of GIC spheres or differentiating cells after 4 days of the treatments with RGD peptide (300 µM) or TMZ (500 µM) alone, or both of agents. The cells were stained with PI for counting the apoptotic cells (red), and Hoechst 33342 for staining the total cells (blue) D. Effects of the RGD peptide and TMZ on GIC spheres and differentiating cells. GIC spheres or serum induced differentiating cells were treated with an integrin-binding peptide (GRGDTP: green), a control peptide (GRGESP: red), or control buffer (blue), and followed by the treatment of TMZ (0, 100, 500 µM) for 4 days, The percentage of apoptotic cells were calculated from the cell number of PI staining cells (for apoptotic cells) in the Hoechst staining cells (for total cells) by MetaMorph software. Data are shown as the mean of 12-field counts in two experiments ±S.E as described in Material and Methods.
Figure 6
Figure 6. Combined treatment of cRGD peptide and TMZ prolonged mouse survival after GICs brain transplantation.
A. Therapeutic schedule for targeting GIC in the brain xenograft mouse model. Before transplantation of GIC, cells were pretreated with cRGD (100 µg/1×105 cells) (red down arrow) or/and control medium (orange down arrow) for 30 min at 37°C, and subjected to the intracranial injection. After the GIC injection, cRGD (5 mg/kg mouse, red arrowhead), TMZ (7.5 mg/kg mouse, blue arrowhead), both of cRGD and TMZ, or control 10% DMSO (5 ml/kg mouse, white arrowhead) was injected intraperitoneally (i.p.) each time point according to the experimental design. The schedule of the i.p. administration was shown, control DMSO (10%): blue dotted line; cRGD peptide: red dotted line; TMZ: blue solid line; cRGD and TMZ: red solid line, for xenograft models, and 10% DMSO: black dotted line for control mice. B. Kaplan-Meier survival curve of mice after GIC transplantation. The mice survivals after treatments of control 10% DMSO (blue dotted line, n = 3; median survival = 53 days), cRGD (red dotted line, n = 3; median survival = 44 days). TMZ (blue line, n = 3; median survival = 77 days), cRGD and TMZ combination (red line, n = 3; median survival = 100 days) were shown. All of control mice after NSC medium injection to brain without GIC (black dotted line, n = 3) were alive more than 5 months. p-value was determined with long-rank test (**p<0.0031).

Similar articles

Cited by

References

    1. Stupp R, Pavlidis N, Jelic S (2005) ESMO Minimum Clinical Recommendations for diagnosis, treatment and follow-up of malignant glioma. Annals of oncology : official journal of the European Society for Medical Oncology/ESMO 16 Suppl 1: i64–65. - PubMed
    1. Pollard SM, Yoshikawa K, Clarke ID, Danovi D, Stricker S, et al. (2009) Glioma stem cell lines expanded in adherent culture have tumor-specific phenotypes and are suitable for chemical and genetic screens. Cell Stem Cell 4: 568–580. - PubMed
    1. Rich JN, Bao S (2007) Chemotherapy and cancer stem cells. Cell stem cell 1: 353–355. - PubMed
    1. Fuchs E, Tumbar T, Guasch G (2004) Socializing with the neighbors: stem cells and their niche. Cell 116: 769–778. - PubMed
    1. Bar EE, Chaudhry A, Lin A, Fan X, Schreck K, et al. (2007) Cyclopamine-mediated hedgehog pathway inhibition depletes stem-like cancer cells in glioblastoma. Stem cells 25: 2524–2533. - PMC - PubMed

Publication types

MeSH terms