. 2013 May 21;8(5):e62654.
doi: 10.1371/journal.pone.0062654. Print 2013.

Tetraspanins CD81 and CD82 facilitate α4β1-mediated adhesion of human erythroblasts to vascular cell adhesion molecule-1

Affiliations

Tetraspanins CD81 and CD82 facilitate α4β1-mediated adhesion of human erythroblasts to vascular cell adhesion molecule-1

Frances A Spring et al. PLoS One. .

Abstract

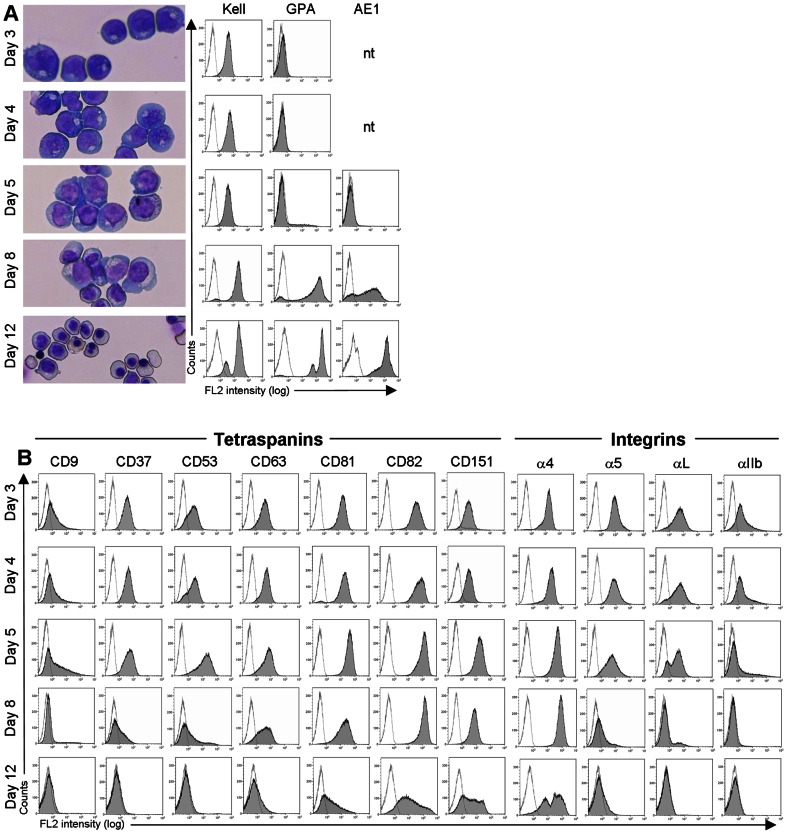
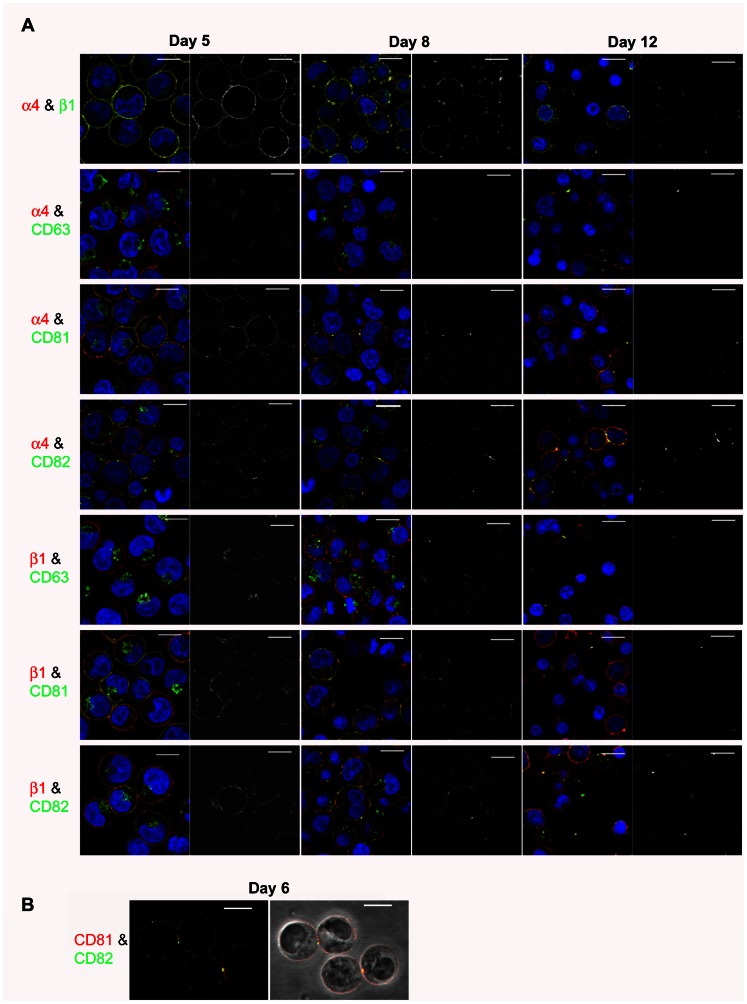
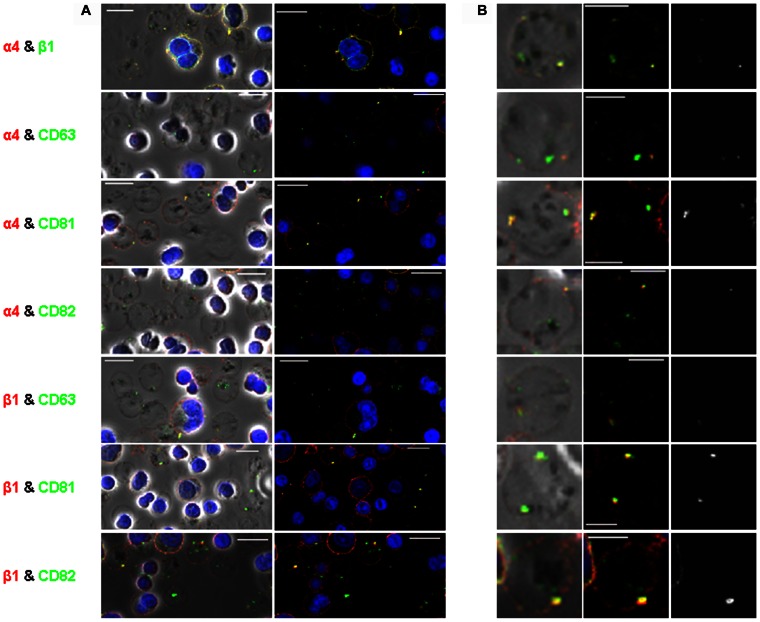
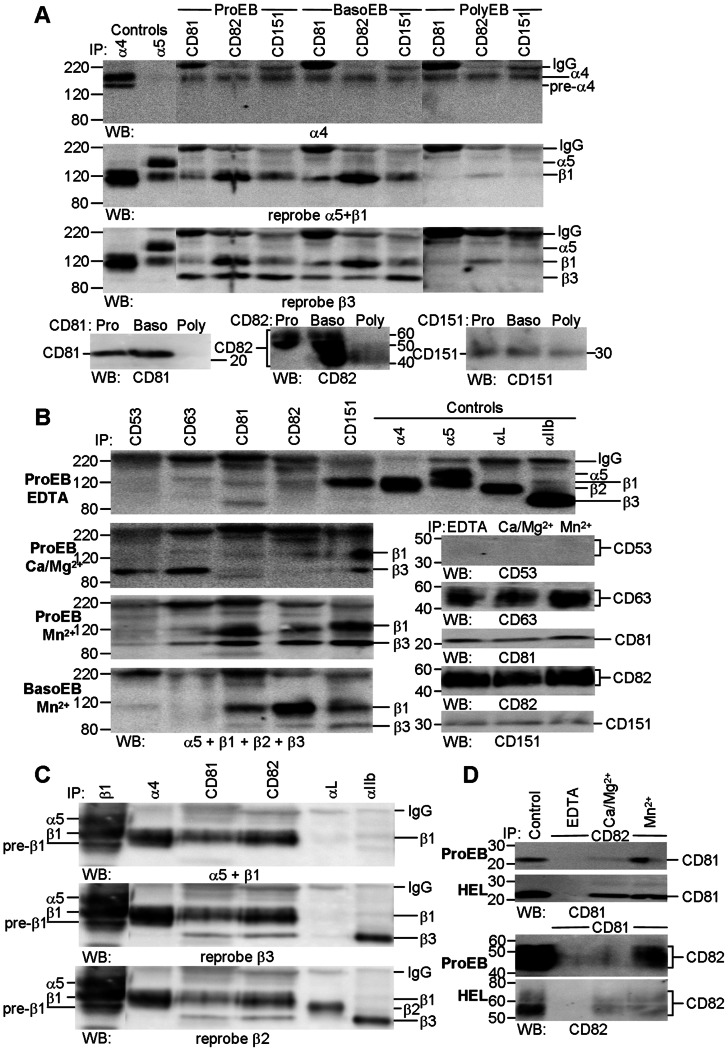
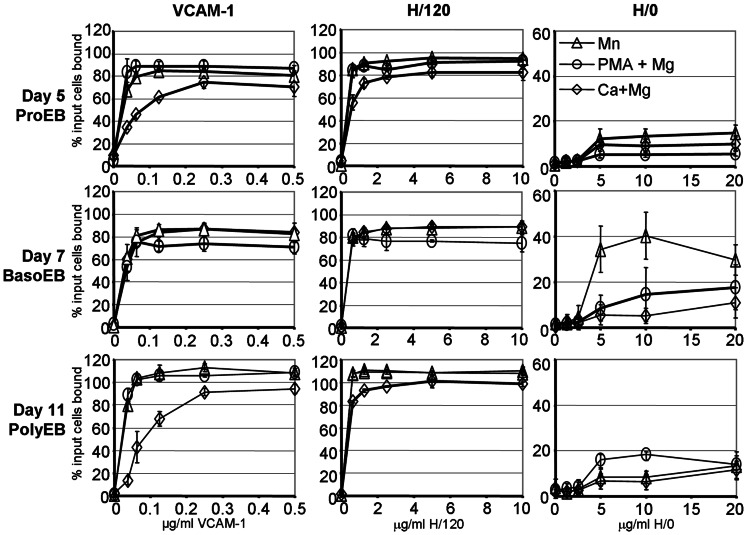
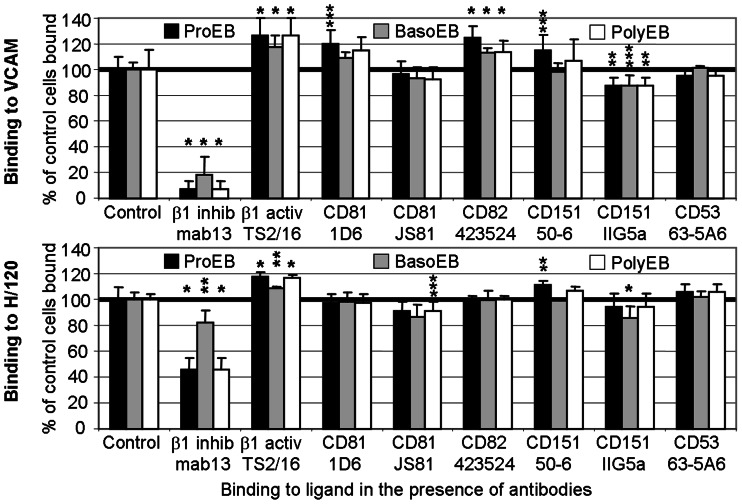
The proliferation and terminal differentiation of erythroid progenitors occurs in human bone marrow within erythroblastic islands, specialised structures consisting of a central macrophage surrounded by developing erythroid cells. Many cell-cell and cell-matrix adhesive interactions maintain and regulate the co-ordinated daily production of reticulocytes. Erythroid cells express only one integrin, α4β1, throughout differentiation, and its interactions with both macrophage Vascular Cell Adhesion Molecule-1 and with extracellular matrix fibronectin are critical for erythropoiesis. We observed that proerythroblasts expressed a broad tetraspanin phenotype, and investigated whether any tetraspanin could modulate integrin function. A specific association between α4β1 and CD81, CD82 and CD151 was demonstrated by confocal microscopy and co-immune precipitation. We observed that antibodies to CD81 and CD82 augmented adhesion of proerythroblasts to Vascular Cell Adhesion Molecule-1 but not to the fibronectin spliceoforms FnIII12-IIICS-15 and FnIII12-15. In contrast, different anti-CD151 antibodies augmented or inhibited adhesion of proerythroblasts to Vascular Cell Adhesion Molecule-1 and the fibronectin spliceoform FnIII12-IIICS-15 but not to FnIII12-15. These results strongly suggest that tetraspanins have a functional role in terminal erythropoiesis by modulating interactions of erythroblast α4β1 with both macrophages and extracellular matrix.


Conflict of interest statement

Competing Interests: The authors have declared that no competing interests exist.

Figures

Figure 1
Figure 1. Erythroid culture characterisation and expression of tetraspanins and integrins during terminal maturation.
A. Temporal expression of erythroid-specific markers, Kell, GPA and AE1 and morphology of the culture at the same time points. AE1 was tested from day 5 onwards. B. Tetraspanin and integrin profile of the same cultures as shown in A. Results are depicted from one culture where directly conjugated antibodies were used (days 3 and 4) and a second culture with indirectly labelled antibodies (day 5 onwards). The y-axis scale is linear to 350 counts; the x-axis is logarithmic to 104. Images were captured on a Leica DM750 microscope, x20 magnification, using Image-Pro Express 6.0 software.
Figure 2
Figure 2. Confocal imaging of erythroblasts.
A. (A) Dual staining of α4 (red) and β1 (green) (top panel) and of tetraspanins CD63, CD81 and CD82 (all green) with α4 and β1 integrins (both red) on days 5, 8 and 12 of culture. Colocalisation is seen in yellow on the coloured images and the adjacent grayscale images highlight yellow areas of colocalisation only (scale bars = 10 µm). (B) Cell surface staining of CD81 (red) and CD82 (green) on day 6 erythroblasts shown in fluorescence and phase contrast. Colocalisation is seen in yellow on the both the coloured and phase images (scale bars = 10 µm).
Figure 3
Figure 3. Confocal imaging of reticulocytes.
A. (A) Dual staining of tetraspanins CD63, CD81 and CD82 (all green) with α4 and β1 integrins (both red) on day 12 of culture shown in phase contrast and fluorescence (scale bars = 10 µm). Colocalisation is seen in yellow. (B) Single examples of reticulocytes zoomed in from images in (A) shown in phase contrast, fluorescence and greyscale images. Yellow on phase contrast and fluorescence denotes colocalisation. The righthand grayscale images highlight yellow areas of colocalisation only (scale bars = 5 µm).
Figure 4
Figure 4. Tetraspanins CD81, CD82 and CD151 are associated with α4β1 throughout erythroid maturation and with β3 in proerythroblasts and basophilic erythroblasts.
A. CD81, CD82 and CD151 precipitates from Mn2+-activated proerythroblasts (ProEB, day 5), basophilic (BasoEB, day 8) and polychromatic (PolyEB, day 12) erythroblasts were successively probed with anti-α4, anti-β1 and anti-β3 antibodies; tetraspanin controls from each time point are also illustrated. All tetraspanins co-precipitated α4 and β1 from erythroblasts B. Tetraspanin precipitates from day 6 proerythroblasts (ProEB) solubilised in the presence of EDTA or different cations, and from Mn2+-activated basophilic erythroblasts (BasoEB, day 8) were probed with a mix of antibodies to α5, β1, β2 and β3 integrins while the control samples were probed with the relevant tetraspanin antibodies. For clarity, integrin controls are illustrated for the EDTA blot but were present on all blots. β1 and β3 integrins were precipitated well only in the presence of Mn2+. C. CD81 and CD82 precipitates from day 5 proerythroblasts were successively probed with different anti-integrin subunit antibodies and demonstrate co-precipitation of β1 and β3 but not α5 or β2 integrins. D. CD81 (454720) and CD82 (53H5) precipitates from day 6 proerythroblasts (ProEB) and HEL cells (HEL) solubilised in the presence of EDTA, Ca2++Mg2+ or Mn2+ probed with anti-CD82 and anti-CD81 antibodies. Each tetraspanin co-precipitates the other most strongly in the presence of Mn2+ from proerythroblasts while any cation permits co-precipitation in HEL cells. Integrins were analysed on 7.5% gels, tetraspanins on 12% gels; non-reducing conditions. Unless stated, the following clones were used: CD53, MEM-53; CD63, MEM-259; CD81, 454720; CD82, TS82b; CD151, IIG5a; α4, HP2/1; α5, IIA1; αL, TS1/22; αIIb, PAB-1. All day 5 and 6 cultures comprised 90–95% proerythroblasts; day 8 culture comprised 5% proerythroblasts, 81% basophilic erythroblasts and 14% polychromatic erythroblasts; day 12 culture comprised 41% polychromatic erythroblasts, 15% orthochromatic erythroblasts and 41% reticulocytes. In the day 5 and 6 cultures 15–34% of cells were GPA+ and 28–35% of cells were αIIb+. Day 8 and day 12 cultures had 77% and 97% GPA+ cells, respectively, and 9% and 0% αIIb+ cells, respectively.
Figure 5
Figure 5. Effect of different activation conditions on erythroblast α4β1 attachment to Vascular Cell Adhesion Molecule-1 and fibronectin fragments, H/120 and H/0.
Erythroblasts were allowed to attach to dilutions of VCAM-1, H/120 and H/0 in the presence of different cations to activate α4β1. ◊, 1 mM Ca2+ plus 1 mM Mg2+; Δ, 1 mM Mn2+; ○, 80 µM PMA plus 10 mM Mg2+. Day 5 cells (proerythroblasts, ProEB) were from one culture while days 7 (basophilic erythroblasts, BasoEB) and 11 (polychromatic erythrobalsts, PolyEB) cells were from a second culture which was also used for the assays depicted in (Fig. 6) on subsequent days. Each data point is the mean of 4 replicates with the ± standard deviation errors bars shown. Readings in excess of 100% input cells bound were only evident in day 11 cells. High levels of haemoglobin within the cells quenches the fluorescence of the initial 100% input cells bound reading, and is evident with highly activated cells; this artefact does not occur with non-haemoglobinised day 5 cells.
Figure 6
Figure 6. Effect of anti-tetraspanin antibodies on erythroblast attachment to Vascular Cell Adhesion Molecule-1 and fibronectin fragment H/120.
Attachment of erythroblasts to ligand in the presence of 1 mM Ca2+ plus 1 mM Mg2+ and 10 µg/ml of isotype control, inhibitory or activating anti-β1 and anti-tetraspanin antibodies. Each data point is the mean of 6 replicates, each expressed as the percentage of the average of the relevant isotype control cells bound (the normalised values); standard deviations are shown, calculated from the normalised values. The results depicted are from the same culture at 3 time points (ProEB, day 5; BasoEB day 8; PolyEB, day 12) and are representative results of the series of data collected. *, P<0.001; **, P<0.050; ***, P = 0.050–0.055 compared with the relevant isotype control values as determined by one way analysis of variation. Box-Whisker plots of the complete series of experiments performed with CD81, CD82 and CD151 clones with both ligands, with statistically significant results highlighted, are depicted in Figures S5 and S6. Altogether 6 cultures were assayed (days 5 and 8 were performed on 5 occasions, day 12 on 4 occasions). The pre-coating concentrations of VCAM-1 and H/120 allowed slightly less than maximal cell attachment. VCAM-1 was pre-coated at 0.2 µg/ml, 0.125 µg/ml and 0.25 µg/ml while H/120 was pre-coated at 2 µg/ml, 1.25 µg/ml and 1 µg/ml for proerythroblasts (ProEB, black bars, day 5), basophilic erythroblasts (BasoEB, grey bars, day 8) and polychromatic erythroblasts (PolyEB, white bars, day 12) respectively. Readings in excess of 100% input cells bound were sometimes evident in haemoglobinised cells (days 8 and 12). High levels of haemoglobin within the cells quenches the fluorescence of the initial 100% input cells bound reading, and was evident only with day 12 cells in this assay (all the H/120 results and only the VCAM-1 with TS2/16 result); this artefact does not occur with non-haemoglobinised day 5 cells. Day 5 culture comprised 5% pre-proerythroblasts, 91% proerythroblasts and 4% basophilic erythroblasts (28% GPA+); day 8 culture comprised 11% proerythroblasts, 60% basophilic erythroblasts and 28% polychromatic erythroblasts (88% GPA+); day 12 culture comprised 15% basophilic erythroblasts, 48% polychromatic erythroblasts, 15% orthochromatic erythroblasts and 21% reticulocytes (99% GPA+).

References

    1. Chasis JA, Mohandas N (2008) Erythroblastic islands: niches for erythropoiesis. Blood 112: 470–478. - PMC - PubMed
    1. Bessis M (1958) [Erythroblastic island, functional unity of bone marrow]. Rev Hematol 13: 8–11. - PubMed
    1. Mohandas N, Prenant M (1978) Three-dimensional model of bone marrow. Blood 51: 633–643. - PubMed
    1. Morris L, Crocker PR, Fraser I, Hill M, Gordon S (1991) Expression of a divalent cation-dependent erythroblast adhesion receptor by stromal macrophages from murine bone marrow. J Cell Sci 99: 141–147. - PubMed
    1. Hanspal M, Hanspal JS (1994) The association of erythroblasts with macrophages promotes erythroid proliferation and maturation: a 30-kD heparin-binding protein is involved in this contact. Blood 84: 3494–3504. - PubMed

Publication types

MeSH terms