

Marine phytoplankton temperature versus growth responses from polar to tropical waters--outcome of a scientific community-wide study
- PMID: 23704890
- PMCID: PMC3660375
- DOI: 10.1371/journal.pone.0063091
Marine phytoplankton temperature versus growth responses from polar to tropical waters--outcome of a scientific community-wide study
Abstract
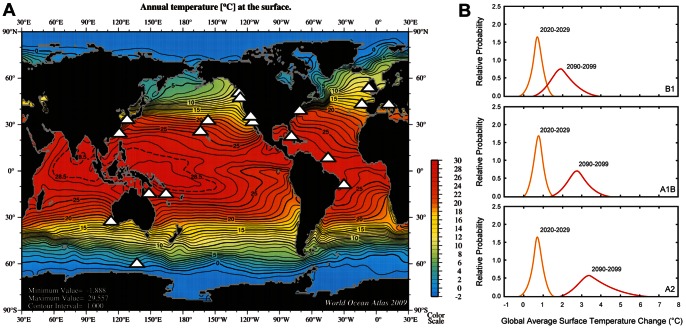
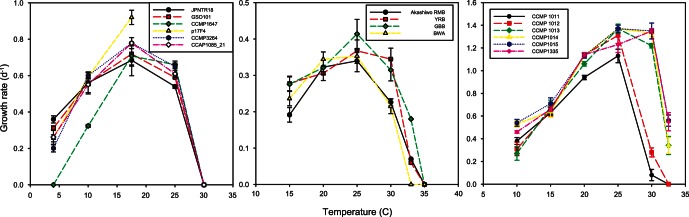
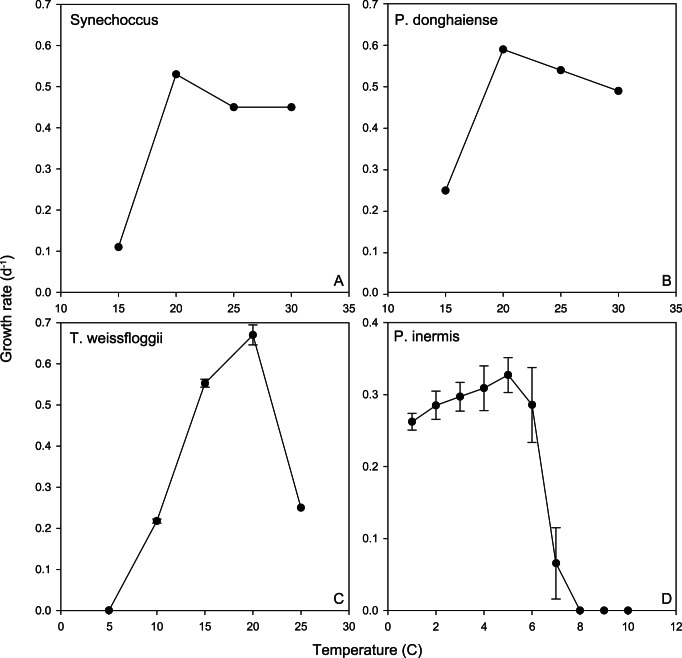
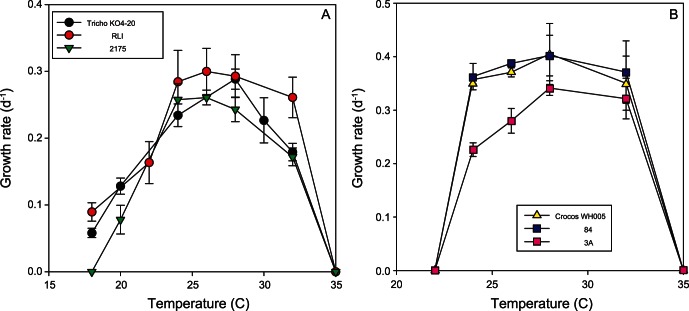
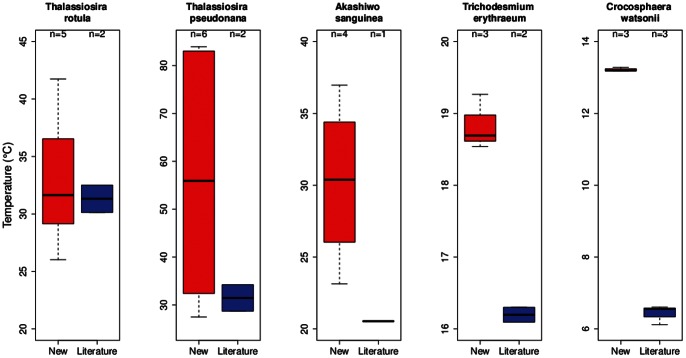
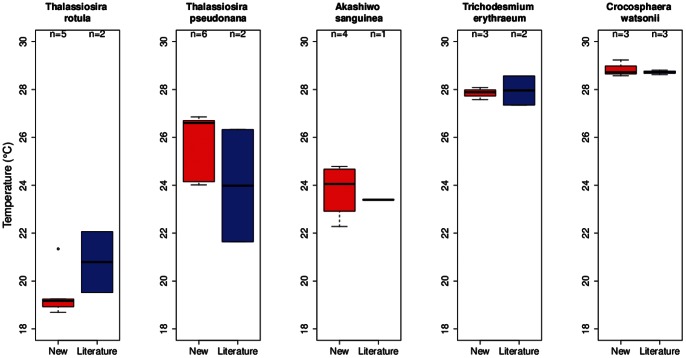
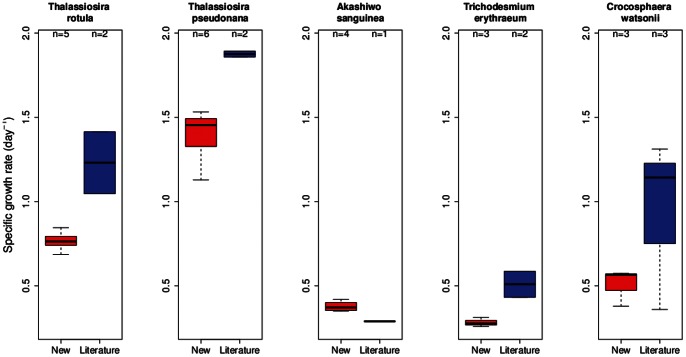
"It takes a village to finish (marine) science these days" Paraphrased from Curtis Huttenhower (the Human Microbiome project) The rapidity and complexity of climate change and its potential effects on ocean biota are challenging how ocean scientists conduct research. One way in which we can begin to better tackle these challenges is to conduct community-wide scientific studies. This study provides physiological datasets fundamental to understanding functional responses of phytoplankton growth rates to temperature. While physiological experiments are not new, our experiments were conducted in many laboratories using agreed upon protocols and 25 strains of eukaryotic and prokaryotic phytoplankton isolated across a wide range of marine environments from polar to tropical, and from nearshore waters to the open ocean. This community-wide approach provides both comprehensive and internally consistent datasets produced over considerably shorter time scales than conventional individual and often uncoordinated lab efforts. Such datasets can be used to parameterise global ocean model projections of environmental change and to provide initial insights into the magnitude of regional biogeographic change in ocean biota in the coming decades. Here, we compare our datasets with a compilation of literature data on phytoplankton growth responses to temperature. A comparison with prior published data suggests that the optimal temperatures of individual species and, to a lesser degree, thermal niches were similar across studies. However, a comparison of the maximum growth rate across studies revealed significant departures between this and previously collected datasets, which may be due to differences in the cultured isolates, temporal changes in the clonal isolates in cultures, and/or differences in culture conditions. Such methodological differences mean that using particular trait measurements from the prior literature might introduce unknown errors and bias into modelling projections. Using our community-wide approach we can reduce such protocol-driven variability in culture studies, and can begin to address more complex issues such as the effect of multiple environmental drivers on ocean biota.
Conflict of interest statement
Figures
References
-
- Bopp L, Monfray P, Aumont O, Dufresne JL, Treut H, et al. (2001) Potential Impact of Climate Change on Marine Export Production. Glob Biogeochem Cy 15: 81–99 doi:10.1029/1999GB001256. - DOI
-
- Sarmiento JL, Slater R, Barber R, Bopp L, Doney SC, et al. (2004) Response of ocean ecosystems to climate warming. Glob Biogeochem Cy 18: GB3003.
-
- [4. Moore JK, Doney SC, Glover DM, Fung IY (2002) Iron cycling and nutrient limitation patterns in surface waters of the world ocean. Deep-Sea Res II 49: 463–508.
-
- Field CB, Behrenfeld MJ, Randerson JT, Falkowski P (1998) Primary production of the biosphere: integrating terrestrial and oceanic components. Science 281: 237–240. - PubMed
Publication types
MeSH terms
Substances
LinkOut - more resources
Full Text Sources
Other Literature Sources
Molecular Biology Databases
Miscellaneous
