. 2013 May 21;8(5):e63577.
doi: 10.1371/journal.pone.0063577. Print 2013.

Transcription factors MYOCD, SRF, Mesp1 and SMARCD3 enhance the cardio-inducing effect of GATA4, TBX5, and MEF2C during direct cellular reprogramming

Affiliations

Transcription factors MYOCD, SRF, Mesp1 and SMARCD3 enhance the cardio-inducing effect of GATA4, TBX5, and MEF2C during direct cellular reprogramming

Nicolas Christoforou et al. PLoS One. .

Abstract

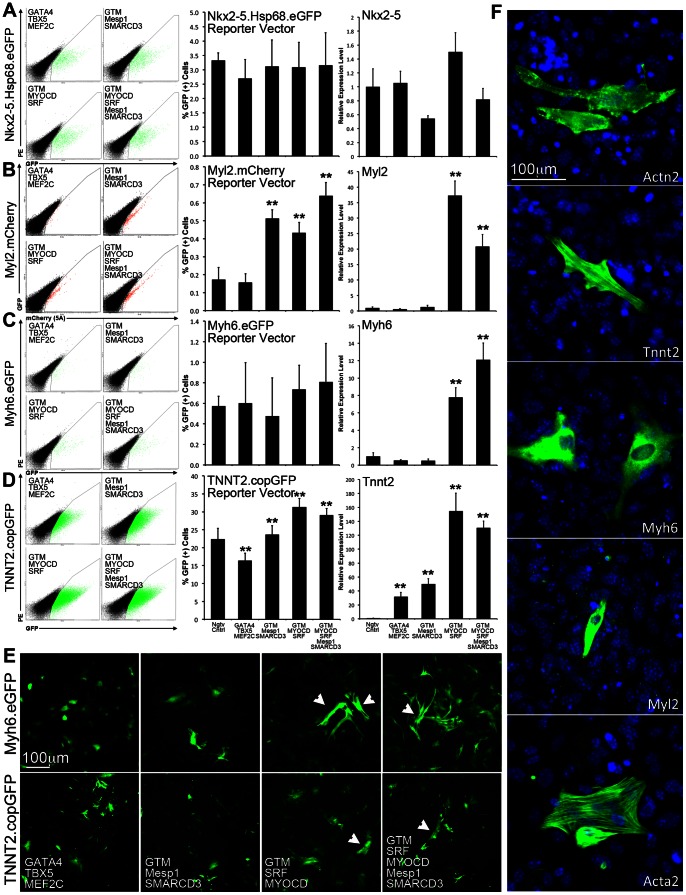
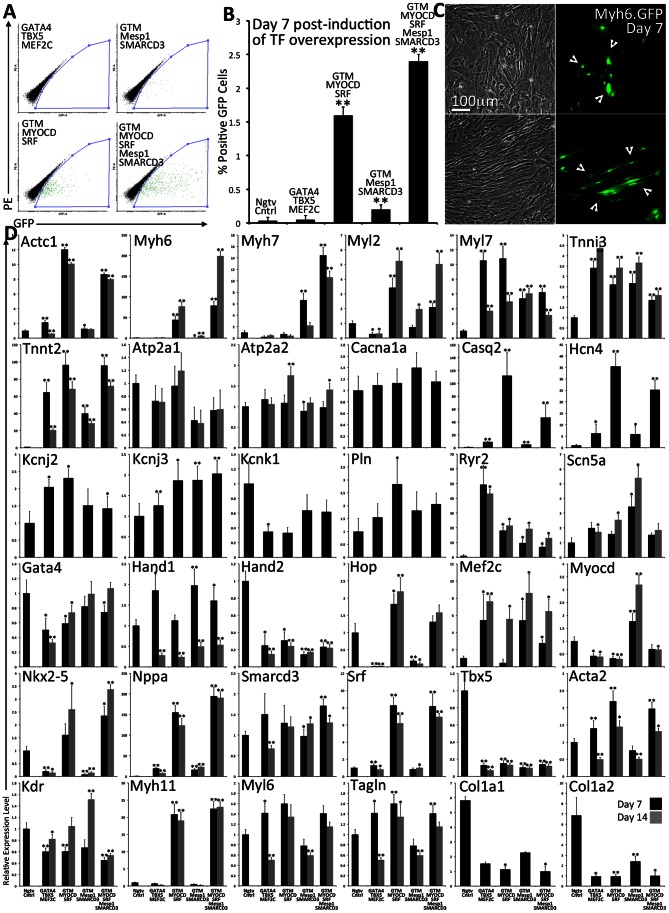
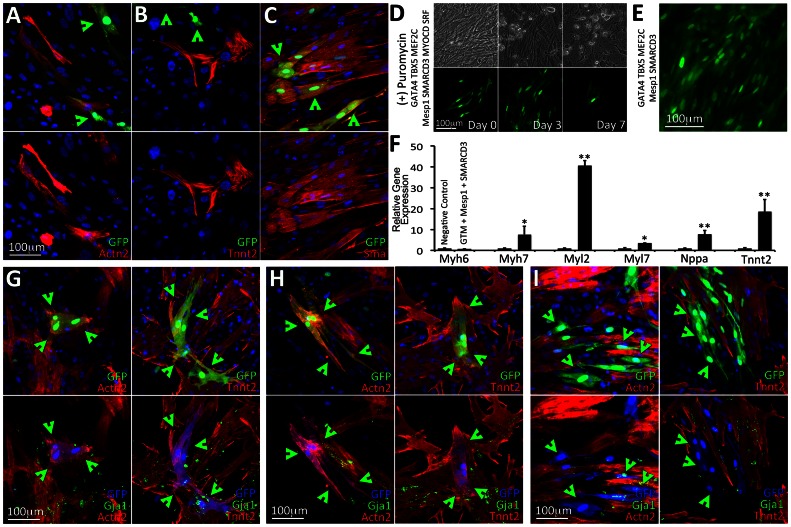
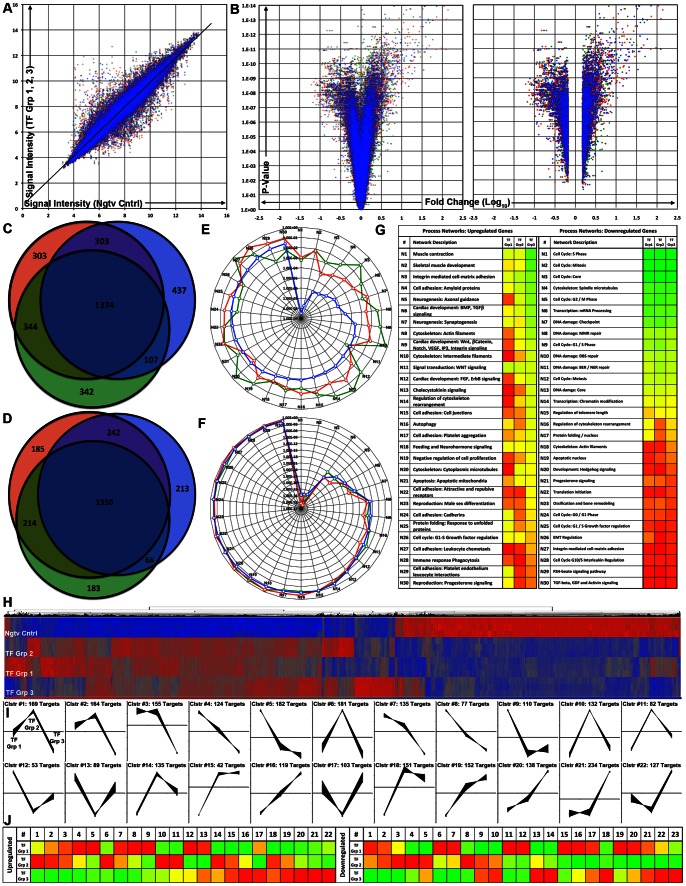
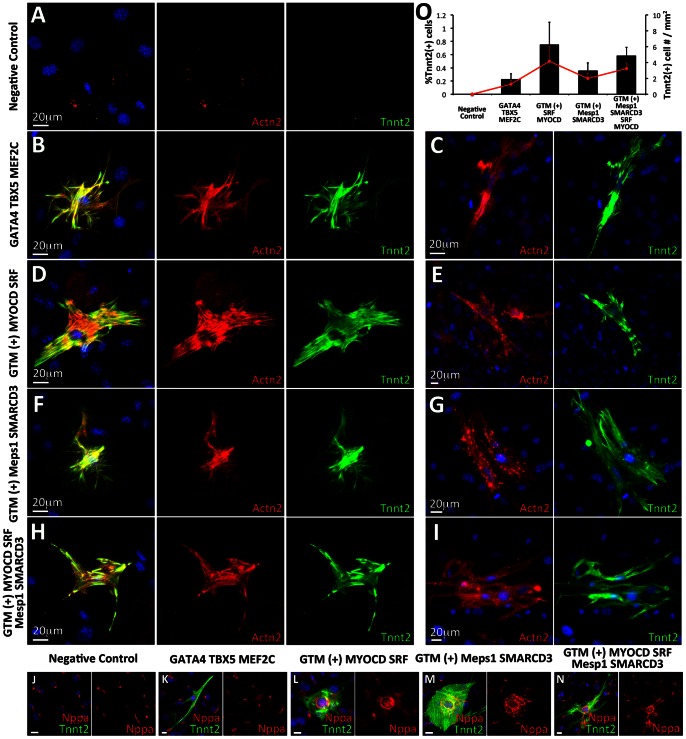
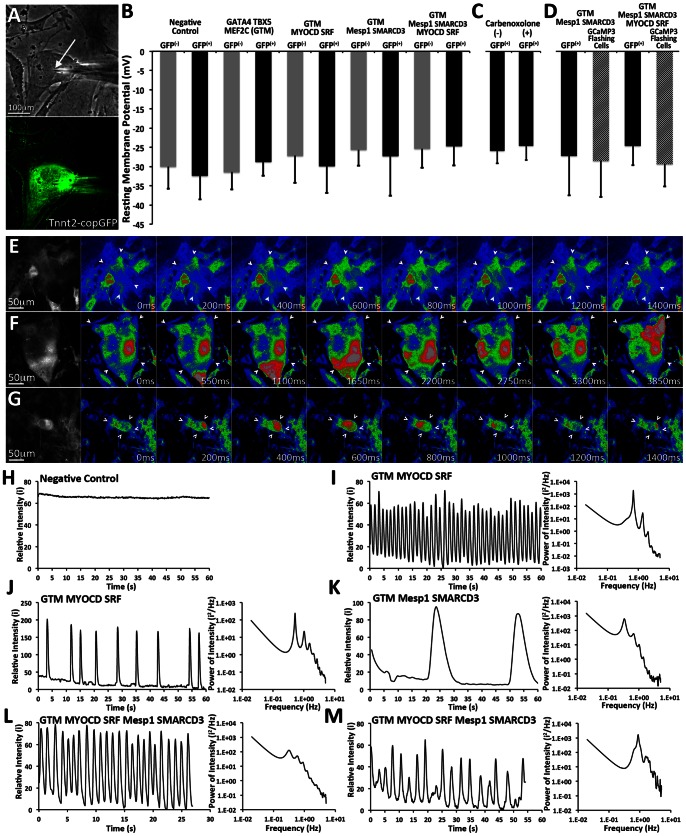
Transient overexpression of defined combinations of master regulator genes can effectively induce cellular reprogramming: the acquisition of an alternative predicted phenotype from a differentiated cell lineage. This can be of particular importance in cardiac regenerative medicine wherein the heart lacks the capacity to heal itself, but simultaneously contains a large pool of fibroblasts. In this study we determined the cardio-inducing capacity of ten transcription factors to actuate cellular reprogramming of mouse embryonic fibroblasts into cardiomyocyte-like cells. Overexpression of transcription factors MYOCD and SRF alone or in conjunction with Mesp1 and SMARCD3 enhanced the basal but necessary cardio-inducing effect of the previously reported GATA4, TBX5, and MEF2C. In particular, combinations of five or seven transcription factors enhanced the activation of cardiac reporter vectors, and induced an upregulation of cardiac-specific genes. Global gene expression analysis also demonstrated a significantly greater cardio-inducing effect when the transcription factors MYOCD and SRF were used. Detection of cross-striated cells was highly dependent on the cell culture conditions and was enhanced by the addition of valproic acid and JAK inhibitor. Although we detected Ca(2+) transient oscillations in the reprogrammed cells, we did not detect significant changes in resting membrane potential or spontaneously contracting cells. This study further elucidates the cardio-inducing effect of the transcriptional networks involved in cardiac cellular reprogramming, contributing to the ongoing rational design of a robust protocol required for cardiac regenerative therapies.


Conflict of interest statement

Competing Interests: The authors have declared that no competing interests exist.

Figures

Figure 1
Figure 1. Determination of transcriptional cardio-inducing effect through detection of reporter vector activity and relative quantification of endogenous gene expression levels.
A–D. Prior to transduction and induction of TF module expression, MEFs were transduced with four different reporter vectors (Nkx2-5.Hsp68.eGFP, Myl2.mCherry, Myh6.eGFP, TNNT2.copGFP). MEFs were subsequently transduced with G4T5MC, G4T5MCM1S3, G4T5MCMDSF, or G4T5MCMDSFM1S3. Negative control MEFs were only transduced with reporter vector and the M2rtTA-expressing lentivirus. The gates were defined using MEFs that were only transduced with the M2rtTA expressing lentivirus and no reporter vector. Following 7 days of induction of TF module expression, the fraction of cells expressing either GFP or mCherry was determined by FACS analysis. The relative gene expression level of the gene used in each of the reporter vectors was determined using quantitative RT.PCR analysis (endogenous locus). Results for both FACS and RTPCR are based on biological triplicates. Error bars represent calculated standard deviation (One *for p-value <0.05, Two *for p-value <0.01). E. Live imaging of cells transduced with either Myh6.eGFP, or TNNT2.copGFP. White arrows point to examples of brightest and elongated cells detected in MEFs transduced with either G4T5MCMDSF, or G4T5MCMDSFM1S3. F. Detection of cardiac protein expression (Actn2, Tnnt2, Myh6, Myl2, Acta2) in MEFs transduced with G4T5MCMDSFM1S3 using immunofluorescence.
Figure 2
Figure 2. Determination of the cardio-inducing effect of four combinations of TF modules in primary transgenic-mouse MEFs.
A–B. Primary MEFs were isolated and expanded from transgenic mice where the expression of GFP is controlled by the myosin heavy chain promoter element. MEFs were transduced with FUW.M2rtTA and one of four transcriptional module combinations: G4T5MC, G4T5MCM1S3, G4T5MCMDSF, G4T5MCMDSFM1S3. Following 7 days of induction of TF overexpression the fraction of cells expressing GFP was determined using FACS. Results are based on biological triplicates. Error bars represent calculated standard deviation (One *for p-value <0.05, Two *for p-value <0.01). C. GFP(+) MEFs were readily detected within 7 days of TF overexpression. We detected GFP(+) cells that were smaller in size (upper panels) or larger and elongated (lower panels). D. RNA was isolated at either 7 (black) or 14 days (gray) post induction of TF overexpression. Using quantitative RT.PCR and custom-designed TaqMan Low Density Array plates we measured the relative gene expression levels normalizing to negative control MEFs (FUW.M2rtTA only). Error bars represent calculated standard deviation (One *for p-value <0.05, Two *for p-value <0.01).
Figure 3
Figure 3. Assaying the level of cardiac protein expression in reprogrammed MEFs and following genetic selection
A–C. GFP(+) cells were readily detected in MEFs transduced with either G4T5MCMDSF, or G4T5MCMDSFM1S3 within 2 days of induction of TF expression. Only rare GFP(+) cells were detected in MEFs transduced with either G4T5MC or G4T5MCM1S3. Using immunofluorescence analysis (day 7) we detected cells staining positive for cardiac antigens Actn2 or Tnnt2 although GFP expression was not always co-localized with these two proteins. We also detected co-localization of GFP expression with Acta2. The GTM label refers to the TF module containing GATA4, TBX5, and MEF2C. D–F. Puromycin was used to positively select for cells activating the transgenic cardiac promoter element in isolated MEFs following transduction and induction of expression of the four TF module combinations. We observed significant death of non-GFP expressing cells following 3 days of low-level puromycin selection (induction day 7+3). In MEFs transduced with either G4T5MCMDSF or G4T5MCMDSFM1S3 GFP(+) cells remained alive but did not proliferate. Following 7 days of puromycin selection, GFP(+) cells for those two TF module combinations peeled off the plastic surface and subsequently underwent apoptosis (D). Rare GFP(+) cells were detected in MEFs transduced with G4T5MCM1S3. The GFP(+) cells proliferated in the presence of puromycin (E). Relative gene expression analysis performed on puromycin-selected surviving GFP(+) cells in MEFs transduced with G4T5MCM1S3 (F). (G–I). Cocultures of transgenic MEFs transduced with the four combinations of TF modules established with freshly isolated neonatal rat ventricular myocytes (NRVMs). Following induction of TF expression for 7 days we assayed cardiac protein expression (Actn2, Tnnt2) and gap junction formation (Gja1). In cocultures where MEFs were transduced with either G4T5MCMDSF or G4T5MCMDSFM1S3 we detected three distinct staining patterns. Firstly, we detected GFP(+) cells with Actn2 or Tnnt2 co-localization. Importantly the cardiac proteins in these cells formed cross-striations (G). Secondly, we detected GFP(+) cells with Actn2 or Tnnt2 co-localization, where however the two cardiac proteins remained unorganized and no cross-striations where detected (H). Thirdly, we detected GFP(+) cells which were negative for either Actn2 or Tnnt2 expression (I). Gja1 staining did not indicate noticeable gap junction formation between the GFP-expressing cells and NRVMs.
Figure 4
Figure 4. Microarray gene expression analysis performed on populations of reprogrammed MEFs
A. Plot of signal intensity ratios for each individual chip probe when comparing MEFs transduced with any of the three combinations of TF modules to the negative control (TF Group 1 G4T5MC (Green), TF Group 2 G4T5MCM1S3 (Red), TF Group 3 G4T5MCMDSFM1S3 (Blue)). B. Volcano plots displaying the relationship between the calculated fold change for each individual chip probe (when comparing each of the treated cell groups and the negative control) versus the P-value determined using ANOVA statistical analysis. The graph on the left contains all the chip probes whereas the graph on the right contains only probes that are significantly upregulated or downregulated (Fold Change<or >1.5, p-value <0.05) (TF Group 1 (Green), TF Group 2 (Red), TF Group 3 (Blue)). C–D. Venn diagrams displaying the numbers of common probe IDs for either significantly upregulated (C) or significantly downregulated chip probes (D) when comparing each of the treated cell groups and the negative control. The 1374 chip probes common for significantly upregulated genes correspond to 1065 genes whereas the 1350 chip probes common for the significantly downregulated genes correspond to 980 genes (TF Group 1 (Green), TF Group 2 (Red), TF Group 3 (Blue)). E–G. Gene process networks that are either activated (E, upregulated genes) or deactivated (F, downregulated genes) in MEFs transduced with the three TF module combinations as compared to negative control, were determined using the Thomson Reuters GeneGo MetaCore™ data meta-analysis tool (TF Group 1 (Green), TF Group 2 (Red), TF Group 3 (Blue)). Based on the list of significantly upregulated or downregulated genes each process network received a p-value indicating the statistical probability that the network is affected in the population of reprogrammed cells. The range of calculated p-values for each process network is graphically represented with a green to red color range (G). Activated networks: Lowest p-value: 3.16×10⁻⁹ (Green) and highest p-value: 6.53×10⁻¹ (Red). Deactivated networks: Lowest p-value: 2.40×10−40 and highest p-value: 7.06×10⁻¹ (Red). H. Graphical representation of hierarchical clustering analysis performed on the union of all of the significantly upregulated (Red, +2.69) or significantly downregulated genes (Blue, −2.69). I–J. Graphical representation of self-organizing map clustering analysis performed on the union of all of the significantly upregulated or significantly downregulated genes. We detected 22 unique self-organized gene groups for the upregulated genes (I) and 23 unique self-organized gene groups for the downregulated genes. Graphical representation of a normalized average gene expression pattern for each of the unique groups identified by self-organizing map clustering analysis for the three combinations of transcriptional modules (J) (Range: −1.5/Green to 1.5/Red).
Figure 5
Figure 5. Reprogrammed MEFs express cardiac specific proteins and organize them in a cross-striated manner
A–I. Induction of TF overexpression for 7 days in MEFs transduced with only FUW.M2rtTA or the four listed combinations of TF modules. The reprogrammed cells were cultured on gelatin-coated plastic in low serum growth medium. Using double-antibody immunofluorescence analysis (Actn2/Red, Tnnt2/Green) we detected cells expressing both cardiac proteins and organizing them in a cross-striated manner resembling cardiomyocytes (B, D, F, H). We detected significantly more double-positive cells in MEFs transduced with G4T5MCMDSF. For each of the transcriptional module combinations we also detected double-positive cells without any obvious cross-striated cytoskeletal organization (C, E, G, I). No Actn2, or Tnnt2 cross-striated expression was detected in the negative control cells. J–N. The Tnnt2 expressing cells also stained positive for the atrial protein marker Nppa. O. Quantification of the fraction of cells staining positive for the Tnnt2 cardiac protein (low serum growth medium) as compared to the total number of cells (black columns) and measurement of the fraction of Tnnt2-expressing cells per square millimeter (red line). Results are based on biological triplicates. Error bars represent calculated standard deviation. All four cell groups had a significant increase in the number of Tnnt2(+) cells as compared to the negative control group (P<0.01). Cells transduced with either G4T5MCMDSF (P<0.01), G4T5MCMDSFM1S3 (P<0.05), G4T5MCMDSFM1S3 (P<0.01) also had a significant increase in the number of Tnnt2(+) cells as compared to cells transduced with G4T5MC.
Figure 6
Figure 6. Electrophysiological characterization of reprogrammed cells.
A–B. A–B. Recordings of RMP were performed using a sharp intracellular microelectrode (white arrow). RMP measurements were performed for either GFP(+) or GFP() cells in groups of MEFs transduced with either G4T5MC (n = 8 & 9), G4T5MCMDSF (n = 7 & 6), G4T5MCM1S3 (n = 7 & 8), G4T5MCMDSFM1S3 (n = 9 & 7), and negative control (n = 6 & 7). ANOVA was used to determine whether significant differences existed in the measured membrane resting potentials amongst the reported cell groups or between the GFP(+) and GFP() cell populations within each cell group. (One *for p-value <0.05, Two *for p-value <0.01). NRVMs as positive control (RMP: −75.78±3.14 mV, n = 8). Error bars represent calculated standard deviation. C. Sharp microelectrode recordings of RMP performed on GFP(+) cells in the presence or absence of 200 µM carbenoxolone, a gap junction uncoupler (n = 8 & 6). Error bars represent calculated standard deviation. D. MEFs were first transduced with either TNNT2.copGFP or TNNT2.GCaMP3 (conditional expression of fluorescent marker under the control of the TNNT2 promoter) and subsequently with the various combinations of TF modules. Sharp microelectrode recordings were performed on either GFP(+) cells or GCaMP3(+) cells that were also exhibiting regular GCaMP3 flashing (n = 8, 4, 7, & 9). Error bars represent calculated standard deviation. E–G. Serial frame images of individual cells GCaMP3 exhibiting flashing GCaMP3 signal (white arrows). Flashing GCaMP3 activity was detected in cells transduced with G4T5MCMDSF (E), G4T5MCM1S3 (F), and G4T5MCMDSFM1S3 (G). The rightmost panels show black and white images of the acquired flashing cells while the rest show color-coded RGB images based on signal intensity (Dark Blue Lowest intensity, Bright Red Highest Intensity). H–M. Plots (left panels) displaying the relative signal intensity for GCaMP3 over time in regions within cells exhibiting GCaMP3 flashing: Negative control (H), G4T5MCMDSF (I, J), G4T5MCM1S3 (K), G4T5MCMDSFM1S3 (L, M).

Similar articles

Cited by

References

    1. Murry CE, Reinecke H, Pabon LM (2006) Regeneration gaps: observations on stem cells and cardiac repair. Journal of the American College of Cardiology 47: 1777–1785. - PubMed
    1. Laflamme MA, Murry CE (2011) Heart regeneration. Nature 473: 326–335. - PMC - PubMed
    1. Burridge PW, Keller G, Gold JD, Wu JC (2012) Production of de novo cardiomyocytes: human pluripotent stem cell differentiation and direct reprogramming. Cell stem cell 10: 16–28. - PMC - PubMed
    1. Maltsev VA, Rohwedel J, Hescheler J, Wobus AM (1993) Embryonic stem cells differentiate in vitro into cardiomyocytes representing sinusnodal, atrial and ventricular cell types. Mechanisms of development 44: 41–50. - PubMed
    1. Kehat I, Kenyagin-Karsenti D, Snir M, Segev H, Amit M, et al. (2001) Human embryonic stem cells can differentiate into myocytes with structural and functional properties of cardiomyocytes. The Journal of clinical investigation 108: 407–414. - PMC - PubMed

Publication types

MeSH terms