. 2013 May 21;8(5):e63729.
doi: 10.1371/journal.pone.0063729. Print 2013.

Dynamic regulation of extracellular signal-regulated kinase (ERK) by protein phosphatase 2A regulatory subunit B56γ1 in nuclei induces cell migration

Affiliations

Dynamic regulation of extracellular signal-regulated kinase (ERK) by protein phosphatase 2A regulatory subunit B56γ1 in nuclei induces cell migration

Ei Kawahara et al. PLoS One. .

Erratum in

  • PLoS One. 2013;8(12). doi:10.1371/annotation/0c13510e-5537-49c0-906f-9cfa842f0363

Abstract

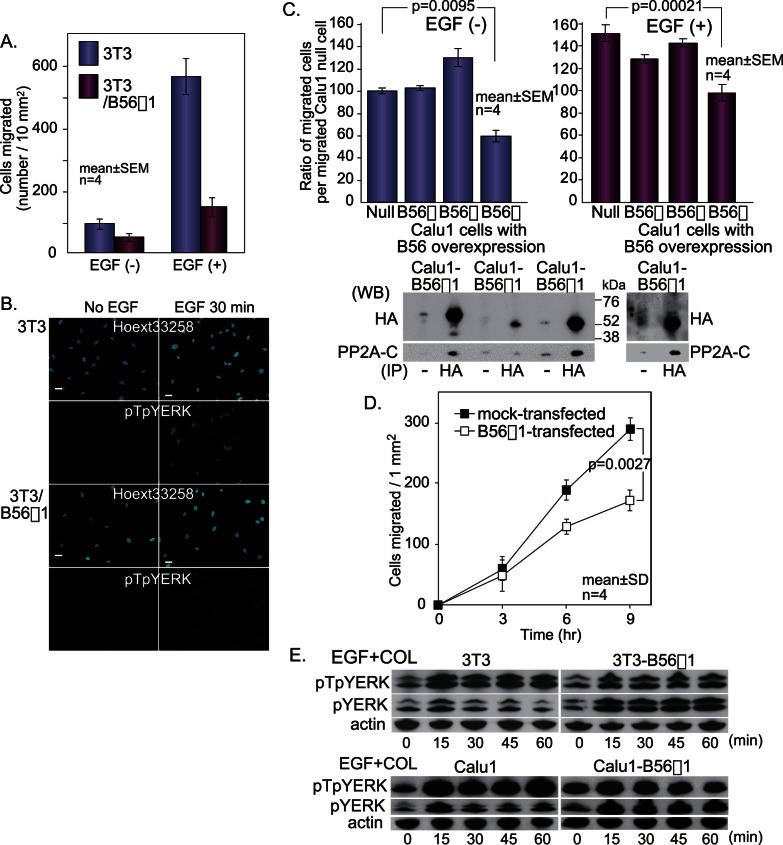
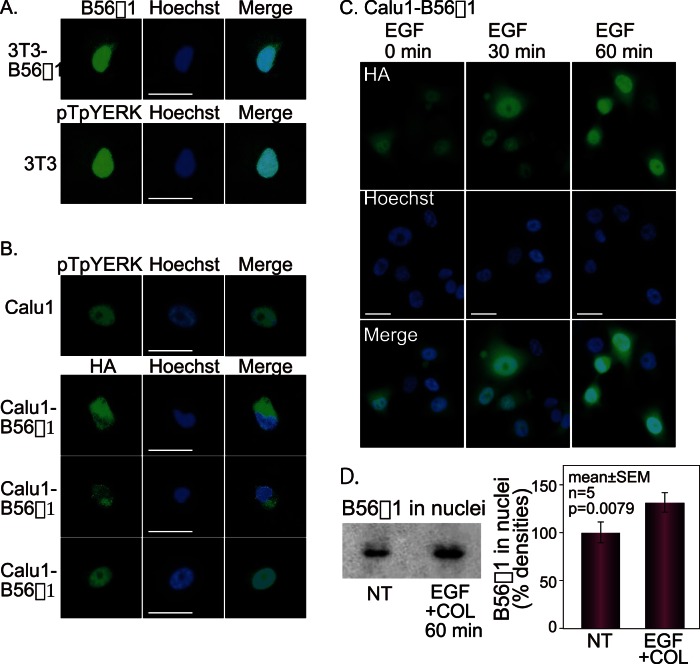
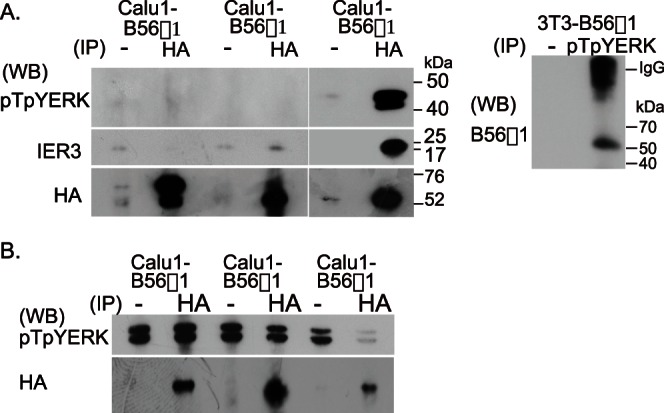
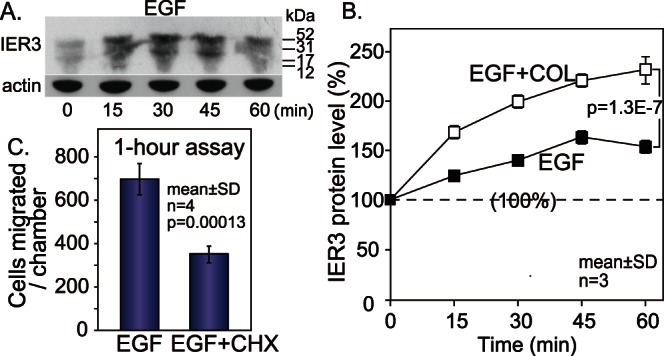
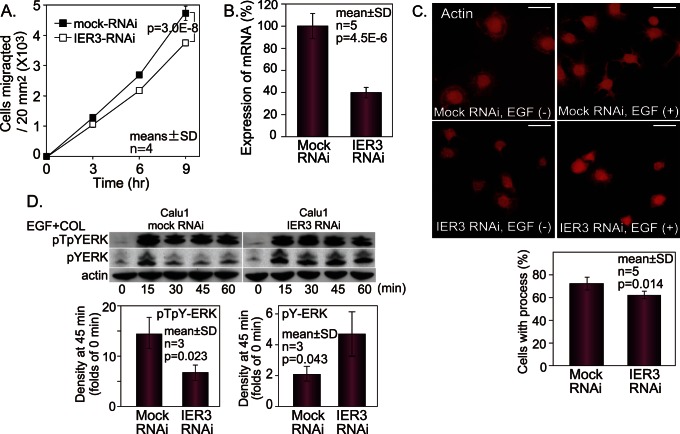
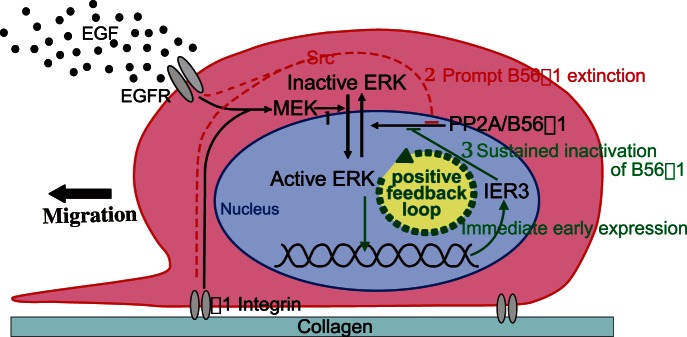
Extracellular signal-regulated kinase (ERK) signalling plays a central role in various biological processes, including cell migration, but it remains unknown what factors directly regulate the strength and duration of ERK activation. We found that, among the B56 family of protein phosphatase 2A (PP2A) regulatory subunits, B56γ1 suppressed EGF-induced cell migration on collagen, bound to phosphorylated-ERK, and dephosphorylated ERK, whereas B56α1 and B56β1 did not. B56γ1 was immunolocalized in nuclei. The IER3 protein was immediately highly expressed in response to costimulation of cells with EGF and collagen. Knockdown of IER3 inhibited cell migration and enhanced dephosphorylation of ERK. Analysis of the time course of PP2A-B56γ1 activity following the costimulation showed an immediate loss of phosphatase activity, followed by a rapid increase in activity, and this activity then remained at a stable level that was lower than the original level. Our results indicate that the strength and duration of the nuclear ERK activation signal that is initially induced by ERK kinase (MEK) are determined at least in part by modulation of the phosphatase activity of PP2A-B56γ1 through two independent pathways.


Conflict of interest statement

Competing Interests: The authors have declared that no competing interests exist.

Figures

Figure 1
Figure 1. EGF- and collagen-stimulated cell migration and ERK phosphorylation.
(A, C–F) Migration assay on collagen using Calu1 carcinoma cells (A, C, E) or Swiss 3T3 fibroblasts (D, F). The cells were allowed to migrate for 5 hours (C, E) or overnight (A, D, F). (A) The dose-dependent effect of EGF on Calu1 cell migration. (B) The dose-dependent effect of EGF on threonine- and tyrosine-phosphorylation of ERK1/2 (pTpYERK) in Calu1 cells. The densities of the bands were measured and plotted on the line chart. (C, D) The effect of PD98059 on EGF-induced cell migration. (E, F) The effect of cycloheximide (CHX) on EGF-induced migration. (G) Kinetics of pTpYERK. Calu1 cells were treated with 10 ng/ml EGF, and the cells were kept in suspension (EGF) or loaded on collagen-coated plates (EGF+COL). The densities of the bands were measured and plotted on the line charts. The levels at 0 min and 15 min were determined by densitometric analysis of samples run in the same gel. One way analysis of variance (A, C, D, E, F) or Student’s t-test (G) was used for statistical analysis.
Figure 2
Figure 2. B56γ1 overexpression inhibits both cell migration and ERK phosphorylation.
(A) The effect of B56γ1 overexpression on migration of 3T3 cells. (B) The effect of B56γ1 overexpression on ERK phosphorylation in 3T3 cells. Bars, 10 µm. (C) The effects of B56 overexpression on migration using permanently transfected Calu1 cells. Migration of Calu1 cells, which were permanently transfected with pCEPB56α1, pCEPB56β1 or pCEPB56γ1, was compared with that of untransfected Calu1 cells (null). B56 protein in each cell line (2×10⁶ cells) is shown by western blotting with anti-HA antibodies following to immunoprecipitation with anti-HA antibodies, and coprecipitated C subunit is shown by western blotting with anti-PP2A-C subunit antibodies. To detect binding of C subunit to B56β1 protein in B56β1-transfected Calu1 cells, 6×10⁶ cells were used and the blot is shown in the right. (D) The effects of B56 overexpression on migration using transiently transfected Calu1 cells. Migration of Calu1 cells, which were transiently transfected with pCEPB56γ1, was compared with that of Calu1 cells, which were transiently transfected with empty plasmids. (E) The effect of B56γ1 overexpression on kinetics of pTpYERK and pYERK after costimulation in Calu1 cells. Scheffe’s multiple comparison after one way analysis of variance (C) or two way analysis of variance (D) was used for statistical analysis.
Figure 3
Figure 3. Nuclear localization of pTpYERK and B56γ1.
(A) Immunolocalization of B56γ1 in 3T3-B56γ1 cells and pTpYERK in 3T3 cells stimulated with EGF on collagen was analyzed using a confocal laser scanning microscope. To detect mouse B56γ1 protein anti-mouse B56γ1 antibodies were used. (B) Immunolocalization of pTpYERK, B56α1, B56β1 and B56γ1 in Calu1 or B56-transfected Calu1 cells stimulated with EGF on collagen. HA-tagged B56 proteins were detected using anti-HA antibodies. Nuclear or perinuclear immunolocalization was detected by a confocal laser scanning microscope. (C) The time course of B56γ1 in nuclei of B56γ1-transfected Calu1 cells on collagen after stimulation with EGF using a conventional fluorescence photomicroscope. Nuclei were stained with Hoechst 33258. Bars, 10 µm. (D) B56γ1 protein in nuclei. EGF was added to suspension of B56γ1-transfected Calu1 cells, and the cells were immediately loaded on a collagen-coated plastic plate. Extracted nuclear protein from the cells with no treatment (NT) and both with EGF and collagen (EGF+COL) was used for western blot analysis using anti-HA antibodies. Paired t-test was used for statistical analysis.
Figure 4
Figure 4. PP2A-B56γ1 binds to and dephosphorylates pTpYERK.
(A) Pull down assay. HA-tagged B56 protein in B56-transfected Calu1 cells was immunoprecipitated with anti-HA antibodies. pTpYERK, IER3 and B56s in the immune complex were detected by western blotting. Similarly, the complex immunoprecipitated from 3T3-B56γ1 cells with rabbit anti-pTpYERK antibodies was run in polyacrylamide gel under non-reducing conditions and B56γ1 was detected by western blotting using rabbit anti-mouse B56γ1 antibodies and HRP-labeled anti-rabbit IgG antibodies. (B) Immune complex phosphatase assay. Immobilized PP2A trimer co-immunoprecipitated with anti-HA antibodies on protein G-Sepharose beads was used as an enzyme and pTpYERK-rich cell lysate of Calu1 cells stimulated with EGF was used as a substrate. Beads suspensions were incubated for 30 min in the crude substrate solution. pTpYERK in the reacted lysate was detected by western blotting. Immunoprecipitated enzyme was quantitated by western blotting using rat anti-HA antibodies.
Figure 5
Figure 5. IER3 protein is promptly synthesized in response to EGF and adhesion.
(A) Kinetics of IER3 protein expression evaluated by western blotting. (B) Kinetics of IER3 protein expression measured by dot blot analysis. (C) The effect of cycloheximide on early migration of Calu1 cells. Two way analysis of variance was used for statistical analysis.
Figure 6
Figure 6. IER3 knockdown decreases cell migration and increase ERK dephosphorylation.
(A) The effect of IER3 RNAi on migration of Calu1 cells. (B) The effect of RNAi on IER3 mRNA expression. (C) The effect of IER3 RNAi on the structure of actin cytoskeleton. The numbers of cells with cytoplasmic processes were counted under a fluorescence microscope. (D) The effect of IER3 RNAi on kinetics of pYERK and pTpYERK. Bars, 10 µm. Two way analysis of variance (A) or Student’s t-test (B, C, D) was used for statistical analysis.
Figure 7
Figure 7. The strength and duration of ERK activation is determined by MEK and PP2A-B56γ1 activities.
(A) The activity of PP2A-B56γ1 phosphatase measured by immune complex fluorometric phosphatase assay using 4-methylumbelliferyl phosphate as a substrate. The closed squares indicate the measured phosphatase activity. Two areas demarcated by dotted lines (“transient phosphorylation” and “IER3”) were deduced from the effect of two distinct factors, i.e., the rapid inactivation of phosphatase activity (probably due to phosphorylation of the C subunit of PP2A) and the later PP2A inactivation reaction by IER3. C subunits of PP2A in the immune complex were detected by western blotting using anti-C subunit antibodies. Since faint blot at 3 min shows non-specific binding to Sepharose beads, densities of non-immune controls (C) and of 3 min are being compared. (B) The kinetics of ERK and MEK activities in Calu1 cells were examined by western blotting. The plot was constructed using data from 3 (0 to 15 min) or 9 (0, 15 to 60 min) repeated experiments.
Figure 8
Figure 8. Schematic illustration of proposed mechanisms of ERK-mediated cell migration regulated by PP2A-B56γ1.
The numbers 1, 2 and 3 indicate the main signalling pathways that regulate ERK activation within the first 60 min following stimulation.

References

    1. Anderson NG, Maller JL, Tonks NK, Sturgill TW (1990) Requirement for integration of signals from two distinct phosphorylation pathways for activation of MAP kinase. Nature 343: 651–653. - PubMed
    1. Gomez N, Cohen P (1991) Dissection of the protein kinase cascade by which nerve growth factor activates MAP kinases. Nature 353: 170–173. - PubMed
    1. Crews CM, Alessandrini A, Erikson RL (1992) The primary structure of MEK, a protein kinase that phosphorylates the ERK gene product. Science 258: 478–480. - PubMed
    1. Wortzel I, Seger R (2011) The ERK Cascade: Distinct functions within various subcellular organelles. Genes Cancer 2: 195–209. - PMC - PubMed
    1. Murphy LO, Blenis J (2006) MAPK signal specificity: the right place at the right time. Trends Biochem Sci 31: 268–275. - PubMed

Publication types

MeSH terms

LinkOut - more resources