. 2013 May 21;8(5):e63746.
doi: 10.1371/journal.pone.0063746. Print 2013.

Increased cholesterol content in gammadelta (γδ) T lymphocytes differentially regulates their activation

Affiliations

Increased cholesterol content in gammadelta (γδ) T lymphocytes differentially regulates their activation

Hsin-Yuan Cheng et al. PLoS One. .

Abstract

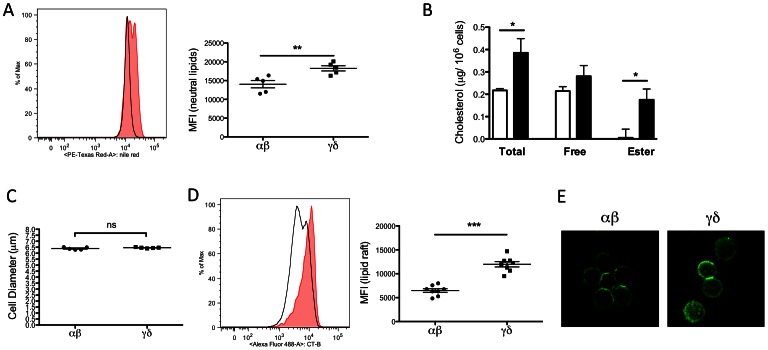
Gammadelta (γδ) T lymphocytes respond quickly upon antigen encounter to produce a cytokine response. In this study, we sought to understand how functions of γδ T cells are differentially regulated compared to αβ T cells. We found that cholesterol, an integral component of the plasma membrane and a regulator of TCR signaling, is increased in γδ T cells compared to αβ T cells, and modulates their function. Higher levels of activation markers, and increased lipid raft content in γδ cells suggest that γδ T cells are more activated. Cholesterol depletion effectively decreased lipid raft formation and activation of γδ T cells, indicating that increased cholesterol content contributes to the hyper-activated phenotype of γδ T cells, possibly through enhanced clustering of TCR signals in lipid rafts. TCR stimulation assays and western blotting revealed that instead of a lower TCR threshold, enhanced TCR signaling through ERK1/2 activation is likely the cause for high cholesterol-induced rapid activation and proliferation in γδ T cells. Our data indicate that cholesterol metabolism is differentially regulated in γδ T cells. The high intracellular cholesterol content leads to enhanced TCR signaling and increases activation and proliferation of γδ T cells.


Conflict of interest statement

Competing Interests: One of the co-authors of the manuscript, Mr. Dan Smith, is employed by Targeson, Inc., a commercial company. Another co-author, Dr. Klaus Ley, is a consultant, but is not employed by Targeson, Inc. However, their affiliation to the company does not alter the authors‚ adherence to all the PLOS ONE policies on sharing data and materials.

Figures

Figure 1
Figure 1. Cholesterol metabolism is differentially regulated in αβ and γδ T cells.
(A) Heat map of sterol PCR array. Genes involved in sterol esterification, utilization, and efflux are upregulated in γδ T cells. Gene expression of αβ T cells was used as control to calculate fold change and hence not shown in the heat map. αβ and γδ T cells were isolated from spleens of the same female C57BL/6J mice by immuno-magnetic beads. (B) Quantitative RT-PCR analysis of genes regulating sterol metabolism. mRNA was isolated from αβ and γδ T cells from the same female C57BL/6J mice, and gene expression was detected by Taqman-based assays. Gapdh was used to normalize gene expression, and gene expression in αβ T cells were set as 1. N = 6. One sample was pooled from 3 mouse spleens. Results were shown in mean ± SEM. * P<0.05, ** P<0.01, *** P<0.001.
Figure 2
Figure 2. γδ T cells have increased intracellular neutral lipids, cholesterol, and lipid rafts.
(A) Splenocytes were isolated from C57BL/6J mice. Intracellular lipid was quantified by Nile Red staining. Left: A representative plot shows the relative intensity of Nile Red staining on αβ (solid black line) and γδ (tinted shade) T cells. Right: Graph shows the median florescent intensity of Nile Red staining on αβ and γδ T cells. Results were averaged from 5 mice, and shown in mean ± SEM. (B) Total and free cholesterol was quantified in purified αβ (white) and γδ (black) T cells from C57BL/6J mouse spleens by gas chromatography. Cholesteryl ester was calculated as the difference between total and free cholesterol (multiplied by 1.67). Intracellular total cholesterol and cholesteryl ester content is significantly higher in γδ T cells. Cholesterol level was normalized to cell numbers. N = 5. (C) αβ and γδ T cells were isolated from splenocytes of C57BL/6J mice. Average cell diameters were obtained from a Multisizer IV Coulter Counter (Beckman Coulter) and showed no significant difference (ns) in αβ and γδ T cells. Results were averaged from 5 mice, and shown in mean ± SEM. (D) Staining for GM1 shows significantly higher lipid raft content on the plasma membrane of γδ T cells. Splenocytes were isolated from C57BL/6J mice. GM1 of lipid raft was identified by cholera toxin subunit B (CT-B) binding. Left: A representative plot shows the relative intensity of CT-B staining on αβ (solid black line) and γδ (tinted shade) T cells. Right: Graph shows the median florescent intensity of CT-B staining on αβ and γδ T cells. Results were averaged from 8 mice. Results were shown in mean ± SEM. * P<0.05, ** P<0.01, *** P<0.001. (E) Confocal microscopic images show increased lipid rafts staining on the membrane of γδ T cells (300×). Green: GM1.
Figure 3
Figure 3. γδ T cells are more activated in vivo.
Cholesterol depletion reduces the activated phenotype of γδ T cells. Cholesterol addition significantly increases the activation status of αβ T cells. (A–B) Staining of T cell activation markers shows more γδ T cell are in the activated state in vivo, comparing to αβ T cells. Splenocytes were isolated from C57BL/6J mice. T cell activation was identified by (A) CD44hi CD62L and (B) CD69+ cells. Representative flow cytometric plots are shown on the left and the percentages of activated T cells are graphed on the right. Results were averaged from 6 mice, and shown in mean ± SEM. (C–E) Splenocytes from C57BL/6J were stimulated with T-activator CD3/CD28 beads for 4 hours in the presence or absence of MβCD to remove cholesterol from the plasma membrane. (C) Reduction of lipid raft levels in αβ and γδ T cells with cholesterol depletion. The reduction was more significant in γδ T cells, and the difference in lipid raft level became insignificant in αβ and γδ T cells after MβCD treatment. Lipid raft content was expressed in median florescent intensity of CT-B staining. (D) The percentage of CD44hi CD62L cells was significantly lower in γδ T cells after 4 hours of cholesterol depletion. (E) The difference in expression of early activation marker CD69 was not statistically significant in both αβ or γδ T cells after MβCD treatment for 4 hours. However, the reduction of CD69 was significant in γδ T cells at 2 hours (inset) Results were averaged from 8 mice. Results were shown in mean ± SEM. (F) C57BL/6J splenocytes were stimulated with T-activator CD3/CD28 beads in the presence or absence of 10 and 20 µg/ml cholesterol for 4 hours. The percentage of CD44hiCD62L cells was significantly increased in αβ T cells in a dose-dependent manner of cholesterol addition. On the other hand, activated γδ T cells were reduced with excess cholesterol. Results were averaged from 8 mice and shown in mean ± SEM. * P<0.05; ** P<0.01; *** P<0.001; ns not statistically significant.
Figure 4
Figure 4. γδ T cells have similar TCR threshold but enhanced ERK1/2 phosphorylation comparing to αβ T cells.
(A) Percentages of BrdU+ proliferative cells are higher in the γδ T cell subset in vivo. Left: representative plots of BrdU+ populations (circled) in αβ and γδ T cells. Right: Graph of percentages of BrdU+ cells in αβ and γδ T cells. C57BL/6J mice received single dose of BrdU (1 mg) via intraperitoneal injection, and splenocytes were isolated 3 days later. BrdU+ cells were identified by fluorescently labeled anti-BrdU antibody and flow cytometry. Results were averaged from 8 mice, and shown in mean ± SEM. *** P<0.001. (B) Top: Splenocytes from C57BL/6J mice were labeled with CFSE (2.5 µM), and then stimulated with 0–10 µg/ml plate-bound αCD3 and 1 µg/ml soluble αCD28 for 24 hours. CFSE content in cells was measured by flow cytometry and graphed against αCD3 concentrations. Results were averaged from 5 mice, and shown in mean ± SEM. Lower: Log scaling of αCD3 concentration against % of maximum response was used to calculate EC50. (C) CD3 expression in γδ T cells was higher than in αβ T cells under no or lower stimulation, but decreased more dramatically with stronger stimulation. The experimental condition was the same as in (B). (D) Western blotting shows high levels of phosphorylated ERK1/2 in γδ T cells, relative to αβ T cells, at baseline. αβ and γδ T cells were isolated from the same set of C57BL/6J mice via FACS sorting. Cells were either untreated, or incubated with αCD3 and αCD28 antibodies (20 µg/ml each) for 5 minutes and then with anti-hamster IgG (20 µg/ml) for additional 2 minutes at 37°C. Cells were lyzed, separated by SDS-PAGE, and immunoblotted with indicated antibodies. The image was representative of 3 independent experiments. (E) Inhibition of ERK1/2 significantly lowers proliferation in γδ T cells in vitro. Splenocytes from C57BL/6J mice were labeled with CFSE (2.5 µM), and then stimulated with 1 µg/ml plate-bound αCD3 and 1 µg/ml soluble αCD28 for 24 hours, in the absence (vehicle) or presence of 10 µM and 25 µM U0126. CFSE dilution in cells was measured by flow cytometry, and used to calculate cell proliferation. Results were averaged from 7–8 mice, and shown in mean ± SEM. ** P<0.01; *** P<0.001; ns not statistically significant.

References

    1. Inghirami G, Zhu BY, Chess L, Knowles DM (1990) Flow cytometric and immunohistochemical characterization of the gamma/delta T-lymphocyte population in normal human lymphoid tissue and peripheral blood. The American journal of pathology 136: 357–367. - PMC - PubMed
    1. Champagne E (2011) gammadelta T cell receptor ligands and modes of antigen recognition. Archivum immunologiae et therapiae experimentalis 59: 117–137. - PMC - PubMed
    1. Kapsenberg ML (2009) Gammadelta T cell receptors without a job. Immunity 31: 181–183. - PubMed
    1. Eberl M, Moser B (2009) Monocytes and gammadelta T cells: close encounters in microbial infection. Trends in immunology 30: 562–568. - PubMed
    1. Fang H, Welte T, Zheng X, Chang GJ, Holbrook MR, et al. (2010) gammadelta T cells promote the maturation of dendritic cells during West Nile virus infection. FEMS immunology and medical microbiology 59: 71–80. - PMC - PubMed

Publication types

MeSH terms

Substances