

Plasma levels of mitochondrial and nuclear DNA in patients with massive pulmonary embolism in the emergency department: a prospective cohort study
- PMID: 23705965
- PMCID: PMC3707013
- DOI: 10.1186/cc12735
Plasma levels of mitochondrial and nuclear DNA in patients with massive pulmonary embolism in the emergency department: a prospective cohort study
Abstract
Introduction: Cell-free plasma mitochondrial DNA (mt-DNA) and nuclear DNA (n-DNA) are biomarkers with prognostic utility in conditions associated with a high rate of cell death. This exploratory study aimed to determine the plasma levels of both nucleic acids in patients with massive and submassive pulmonary embolism (PE) and to compare them with other biomarkers, such as heart-type fatty acid-binding protein (H-FABP) and troponin I (Tn-I) METHODS: This was a prospective observational study of 37 consecutive patients with massive PE, 37 patients with submassive PE, and 37 healthy subjects. Quantifications of plasma mt-DNA and n-DNA with real-time quantitative polymerase chain reaction (PCR), and plasma H-FABP and Tn-I by commercial assays, were done on blood samples drawn within 4 hours after presentation at the emergency department.
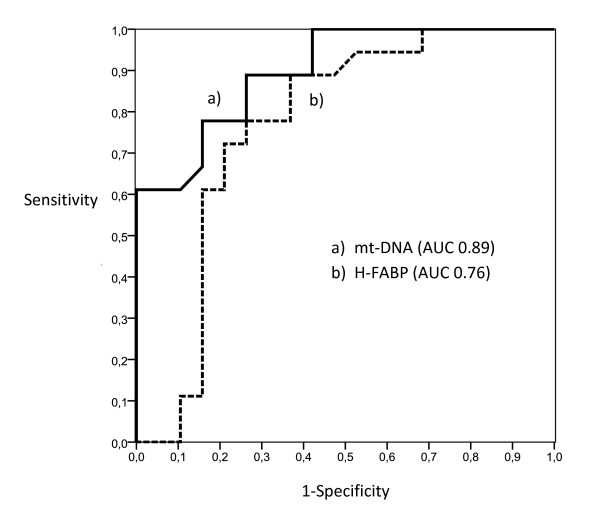
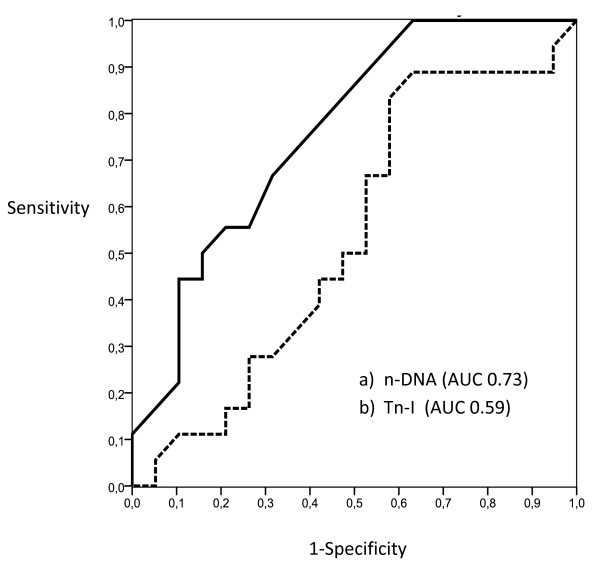
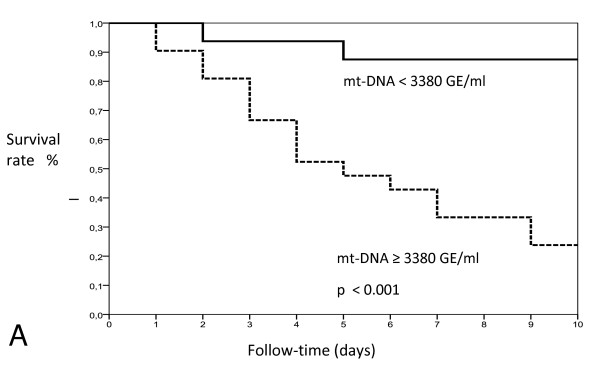
Results: Plasma mt-DNA and n-DNA concentrations were much higher in patients with massive PE (median, 2,970 GE/ml; interquartile range (IQR), 1,050 to 5,485; and 3,325 GE/ml, IQR: 1,080 to 5,790, respectively) than in patients with submassive PE (870 GE/ml and 1,245 GE/ml, respectively; P < 0.01) or controls (185 GE/ml and 520 GE/ml, respectively). Eighteen patients with massive PE died of a PE-related cause by day 15 of observation. Plasma mt-DNA and n-DNA values were 2.3-fold and 1.9-fold higher in the subgroup of nonsurviving patients than in survivors. H-FABP and Tn-I values were also higher in patients with massive PE who died (7.3 ng/ml and 0.023 ng/ml, respectively) than in those who survived (6.4 ng/ml, and 0.016 ng/ml, respectively). By receiver operating curve (ROC) analysis, the best cutoff values for predicting 15-day mortality were 3,380 GE/ml for mt-DNA, 6.8 ng/ml for H-FABP, 3,625 GE/ml for n-DNA, and 0.020 ng/ml for Tn-I, based on the calculated areas under the curve (AUCs) of 0.89 (95% confidence interval (CI), 0.78 to 0.99), 0.76 (95% CI, 0.69 to 093), 0.73 (95% CI, 0.58 to 0.91), and 0.59 (95% CI, 0.41 to 0.79), respectively. By stepwise logistic regression, a plasma mt-DNA concentration greater than 3,380 GE/ml (adjusted odds ratio (OR), 8.22; 95% CI, 1.72 to 39.18; P < 0.001) and a plasma value of H-FBAP >6.8 ng/ml (OR, 5.36; 95% CI, 1.06 to 27.08; P < 0.01) were the only independent predictors of mortality.
Conclusions: mt-DNA and H-FBAP might be promising markers for predicting 15-day mortality in massive PE, with mt-DNA having better prognostic accuracy.
Figures
Comment in
-
Cell-free DNA as a promising marker for risk stratification of pulmonary embolism.Crit Care. 2013 Nov 19;17(6):464. doi: 10.1186/cc13118. Crit Care. 2013. PMID: 24245555 Free PMC article. No abstract available.
Similar articles
-
Predictive value of the heart-type fatty acid-binding protein and the Pulmonary Embolism Severity Index in patients with acute pulmonary embolism in the emergency department.Acad Emerg Med. 2014 Oct;21(10):1143-50. doi: 10.1111/acem.12484. Acad Emerg Med. 2014. PMID: 25308138
-
Heart-type fatty acid-binding protein and myocardial creatine kinase enable rapid risk stratification in normotensive patients with pulmonary embolism.J Crit Care. 2016 Oct;35:174-9. doi: 10.1016/j.jcrc.2016.05.014. Epub 2016 May 26. J Crit Care. 2016. PMID: 27481755
-
The predictive value of heart-type fatty acid-binding protein is independent from symptom duration in normotensive patients with pulmonary embolism.Thromb Res. 2013 Nov;132(5):543-7. doi: 10.1016/j.thromres.2013.09.022. Epub 2013 Sep 24. Thromb Res. 2013. PMID: 24094603
-
Risk stratification in acute pulmonary embolism with heart-type fatty acid-binding protein: A meta-analysis.J Crit Care. 2015 Oct;30(5):1151.e1-7. doi: 10.1016/j.jcrc.2015.05.026. Epub 2015 Jun 3. J Crit Care. 2015. PMID: 26111917 Review.
-
Heart-type fatty acid-binding protein: an overlooked cardiac biomarker.Ann Med. 2020 Dec;52(8):444-461. doi: 10.1080/07853890.2020.1800075. Epub 2020 Aug 4. Ann Med. 2020. PMID: 32697102 Free PMC article. Review.
Cited by
-
Changes in circulating cell-free nuclear DNA and mitochondrial DNA of patients with adolescent idiopathic scoliosis.BMC Musculoskelet Disord. 2019 Oct 25;20(1):479. doi: 10.1186/s12891-019-2869-5. BMC Musculoskelet Disord. 2019. PMID: 31653238 Free PMC article.
-
Assessment of cell free mitochondrial DNA as a biomarker of disease severity in different viral infections.Pak J Med Sci. 2020 Jul-Aug;36(5):860-866. doi: 10.12669/pjms.36.5.2476. Pak J Med Sci. 2020. PMID: 32704253 Free PMC article.
-
Increase of Neutrophil Activation Markers in Venous Thrombosis-Contribution of Circulating Activated Protein C.Int J Mol Sci. 2020 Aug 6;21(16):5651. doi: 10.3390/ijms21165651. Int J Mol Sci. 2020. PMID: 32781781 Free PMC article.
-
The Pathogenesis of Sepsis and Potential Therapeutic Targets.Int J Mol Sci. 2019 Oct 29;20(21):5376. doi: 10.3390/ijms20215376. Int J Mol Sci. 2019. PMID: 31671729 Free PMC article. Review.
-
In vivo attenuation and genetic evolution of a ST247-SCCmecI MRSA clone after 13 years of pathogenic bronchopulmonary colonization in a patient with cystic fibrosis: implications of the innate immune response.Mucosal Immunol. 2015 Mar;8(2):362-71. doi: 10.1038/mi.2014.73. Epub 2014 Aug 13. Mucosal Immunol. 2015. PMID: 25118167
References
-
- Torbicki A, Perrier A, Konstantinides S, Agnelli G, Galiè N, Pruszczyk P, Bengel F, Brady AJ, Ferreira D, Janssens U, Klepetko W, Mayer E, Remy-Jardin M, Bassand JP. Guidelines on the diagnosis and management of acute pulmonary embolism: The Task Force for the Diagnosis and Management of Acute Pulmonary Embolism of the European Society of Cardiology (ESC) Eur Heart J. 2008;29:2276–2315. - PubMed
-
- Jaff MR, McMurtry MS, Archer SL, Cushman M, Goldenberg N, Goldhaber SZ, Jenkins JS, Kline JA, Michaels AD, Thistlethwaite P, Vedantham S, White RJ, Zierler BK. Management of massive and submassive pulmonary embolism, iliofemoral deep vein thrombosis, and chronic thromboembolic pulmonary hypertension: a scientific statement from the American Heart Association. Circulation. 2011;123:1788–1830. doi: 10.1161/CIR.0b013e318214914f. - DOI - PubMed
Publication types
MeSH terms
Substances
LinkOut - more resources
Full Text Sources
Other Literature Sources
Medical
Research Materials
