. 2013 May 24;17(3):R93.
doi: 10.1186/cc12738.

Limits of normality of quantitative thoracic CT analysis

Limits of normality of quantitative thoracic CT analysis

Massimo Cressoni et al. Crit Care. .

Abstract

Introduction: Although computed tomography (CT) is widely used to investigate different pathologies, quantitative data from normal populations are scarce. Reference values may be useful to estimate the anatomical or physiological changes induced by various diseases.

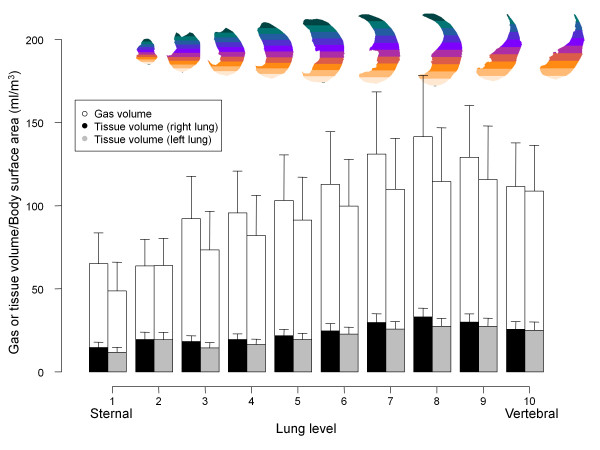
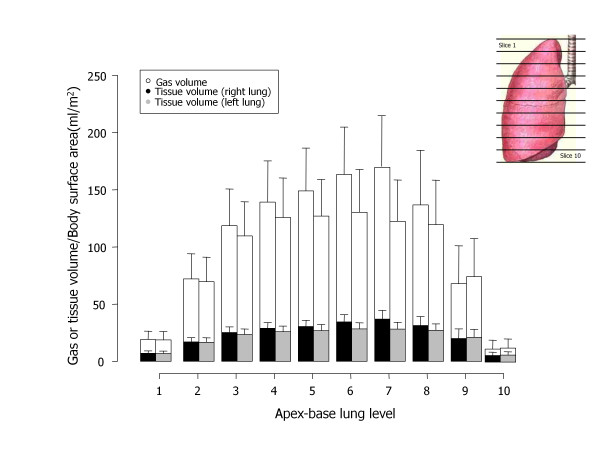
Methods: We analyzed 100 helical CT scans taken for clinical purposes and referred as nonpathological by the radiologist. Profiles were manually outlined on each CT scan slice and each voxel was classified according to its gas/tissue ratio. For regional analysis, the lungs were divided into 10 sterno-vertebral levels.

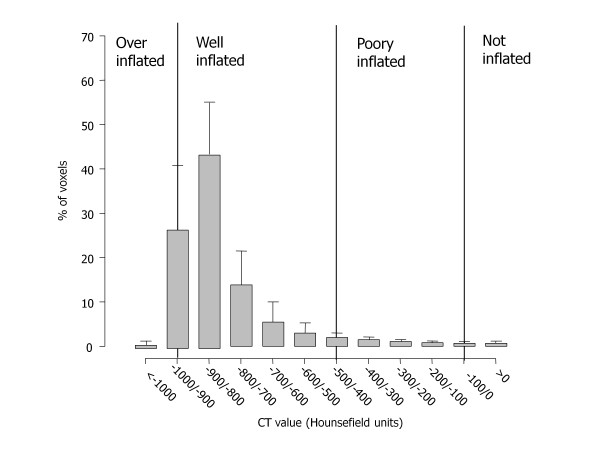
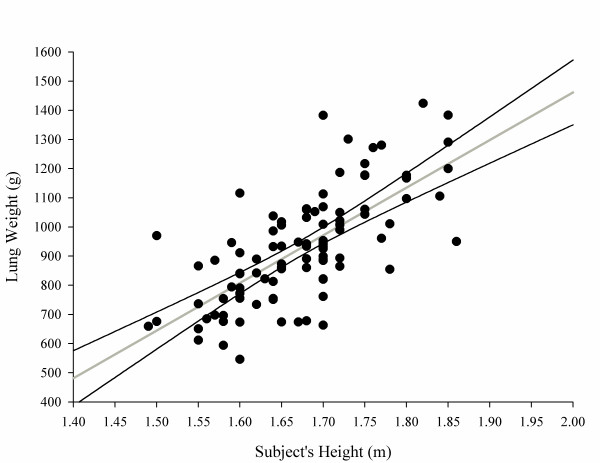
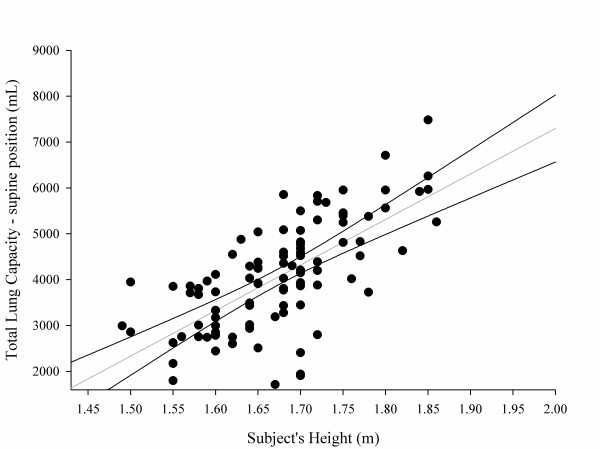
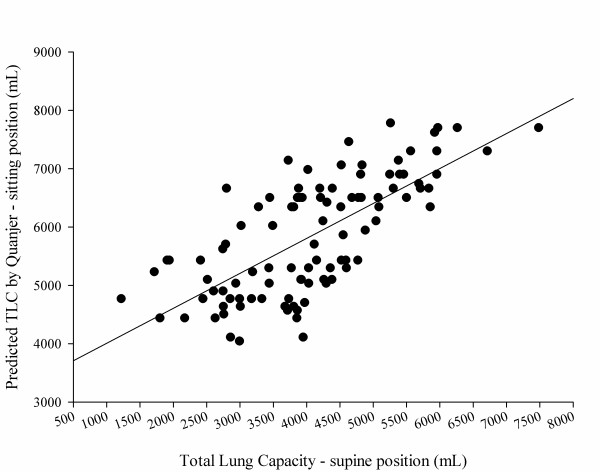
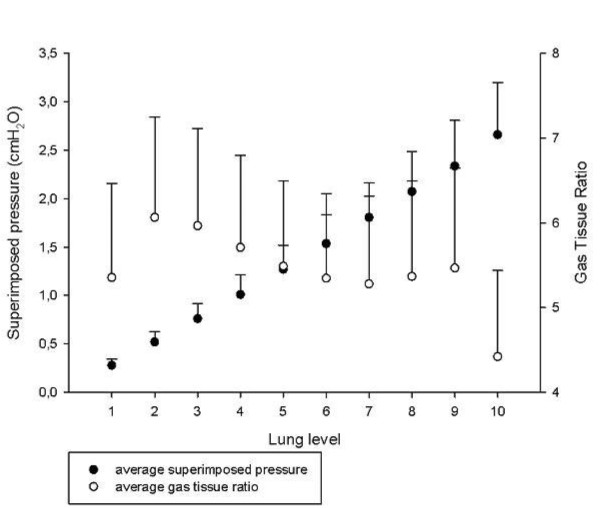
Results: We studied 53 males and 47 females (age 64 ± 13 years); males had a greater total lung volume, lung gas volume and lung tissue. Noninflated tissue averaged 7 ± 4% of the total lung weight, poorly inflated tissue averaged 18 ± 3%, normally inflated tissue averaged 65 ± 8% and overinflated tissue averaged 11 ± 7%. We found a significant correlation between lung weight and subject's height (P <0.0001, r2 = 0.49); the total lung capacity in a supine position was 4,066 ± 1,190 ml, ~1,800 ml less than the predicted total lung capacity in a sitting position. Superimposed pressure averaged 2.6 ± 0.5 cmH2O.

Conclusion: Subjects without lung disease present significant amounts of poorly inflated and overinflated tissue. Normal lung weight can be predicted from patient's height with reasonable confidence.


Figures

Figure 1
Figure 1
Frequency distribution of Hounsfield unit numbers. Frequency distribution of attenuation divided into intervals of 50 Hounsfield units (HU). Vertical lines indicate the ranges of lung inflation used in the literature: overinflated, between -1,000 and -901 HU; well aerated, between -900 and -501 HU; poorly aerated, between -500 and -101 HU; not aerated, <-100 HU. Note that frequency distribution refers to volume and not to weight. CT, computed tomography
Figure 2
Figure 2
Lung weight as a function of subject height. Lung weight (g) = -1,806.1 + 1,633.7 × subject's height (m). The 2.5 to 97.5% confidence interval for intercept = -2,364.67 to -1,247.63; 2.5 to 97.5% confidence interval for slope = 1,300.53 to 1,966.93; P <0.0001, r2 = 0.49.
Figure 3
Figure 3
Lung weight as a function of subject's age. Lung weight (g) = 1,157.03 - 3.56 × subject's age (years). P= 0.01, r2 = 0.06.
Figure 4
Figure 4
Total lung capacity in a supine position as a function of patient height (m). Total lung capacity in a supine position (ml) = -12,550 + 9,924 × subject's height (m). The 2.5 to 97.5% confidence interval for intercept = 16,227 to 8,872; 2.5 to 97.5% confidence interval for slope = 7,730 to 12,118; P <0.0001, r2 = 0.45.
Figure 5
Figure 5
Total lung capacity in a sitting position predicted according to Quanjer and colleagues [9,12]. Total lung capacity (TLC) measured in a supine position as a function of computed tomography (CT) scan. (A) According to Quanjer and colleagues [9,12]: TLC (ml) (sitting) = 3,409 + 0.60 × CT scan (supine). P <0.0001, r2 = 0.50. (B) Bland-Altman plot of the previous correlation. The average difference between the TLC predicted by Quanjer and colleagues [9,12] (sitting) and the CT scan TLC (supine) was 1,779 ± 849 ml (930 to 2,628). The difference between the predicted sitting TLC and the measured supine TLC decreased with the total gas volume increase. The difference between predicted TLC (Quanjer and colleagues) and measured TLC = 2,770 - 0.20 × (predicted TLC + measured TLC) / 2. P <0.001, r2 = 0.05.
Figure 6
Figure 6
Gas and tissue volume in 10 sterno-vertebral levels. The sterno-vertebral distribution of gas (white) or tissue (gray for the right lung, black for the left lung) volumes, normalized for the body surface area (BSA). As the image shows, each lung was divided into 10 sterno-vertebral segments of equal height along the apex-base axis, as described by Pelosi and colleagues [6]. Sterno-vertebral levels with the same number were merged (that is, all of the segments level 1 from apex to base, etc.), in order to obtain 10 regions for each lung and then a quantitative analysis was performed.
Figure 7
Figure 7
Superimposed pressure and gas/tissue ratio as a function of the sterno-vertebral level. Average superimposed pressure (filled circles) and the average gas/tissue ratio (empty circles) as a function of the sterno-vertebral level.
Figure 8
Figure 8
Gas and tissue volume in 10 apex-base levels. Apex-base distribution of gas (white) or tissue (gray for the right lung, black for the left lung) volumes, normalized for the body surface area (BSA); each lung was divided into 10 apex-base segments of equal height along the sterno-vertebral axis. Apex-base levels with the same number were merged (that is, all of the segments level 1, level 2, level 3, etc.), in order to obtain 10 regions for each lung and then a quantitative analysis was performed).

References

    1. Gattinoni L, Chiumello D, Cressoni M. Pulmonary computed tomography and adult respiratory distress syndrome. Swiss Med Wkly. 2005;17:169–174. - PubMed
    1. Gattinoni L, Pesenti A, Bombino M. Relationships between lung computed tomographic density, gas exchange, and PEEP in acute respiratory failure. Anesthesiology. 1988;17:824–832. - PubMed
    1. Gattinoni L, Bombino M, Pelosi P. Lung structure and function in different stages of severe adult respiratory distress syndrome. JAMA. 1994;17:1772–1779. - PubMed
    1. Gattinoni L, D'Andrea L, Pelosi P. Regional effects and mechanism of positive end-expiratory pressure in early adult respiratory distress syndrome. JAMA. 1993;17:2122–2127. - PubMed
    1. Gattinoni L, Pelosi P, Vitali G, Pesenti A, D'Andrea L, Mascheroni D. Body position changes redistribute lung computed-tomographic density in patients with acute respiratory failure. Anesthesiology. 1991;17:15–23. - PubMed