

Evaluating the diffusion coefficient of dopamine at the cell surface during amperometric detection: disk vs ring microelectrodes
- PMID: 23706095
- PMCID: PMC3737586
- DOI: 10.1021/ac400965d
Evaluating the diffusion coefficient of dopamine at the cell surface during amperometric detection: disk vs ring microelectrodes
Abstract
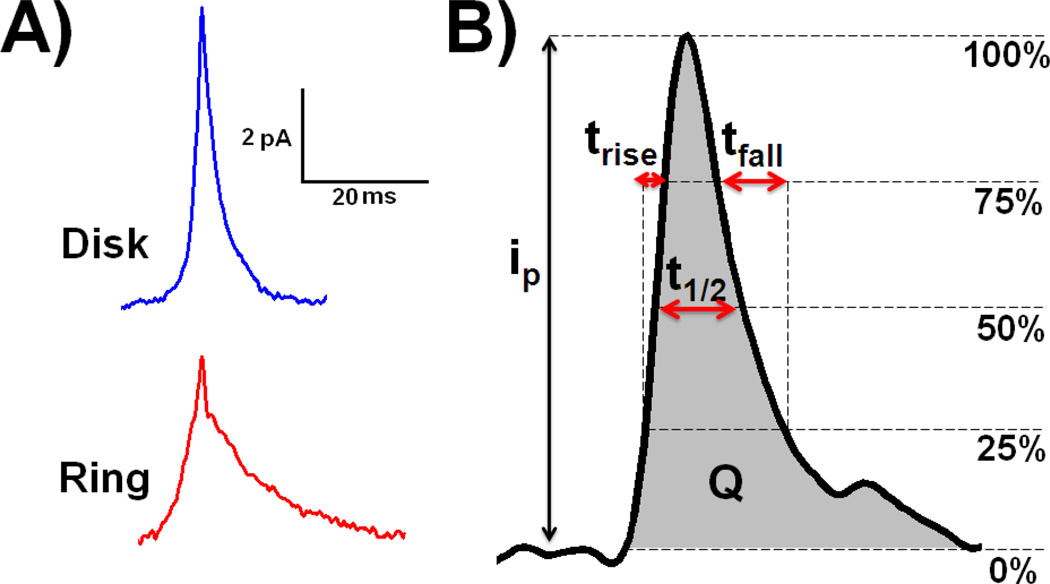
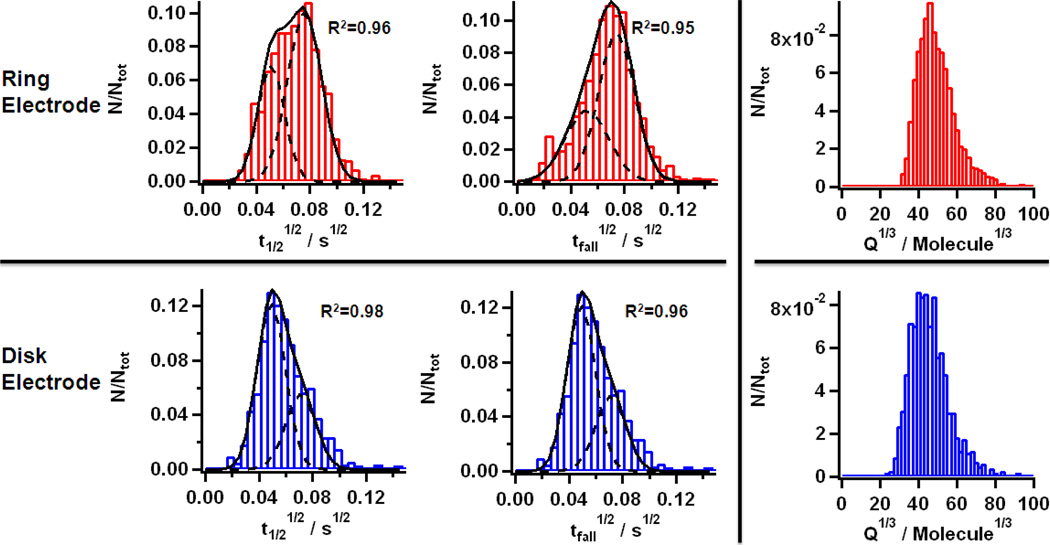
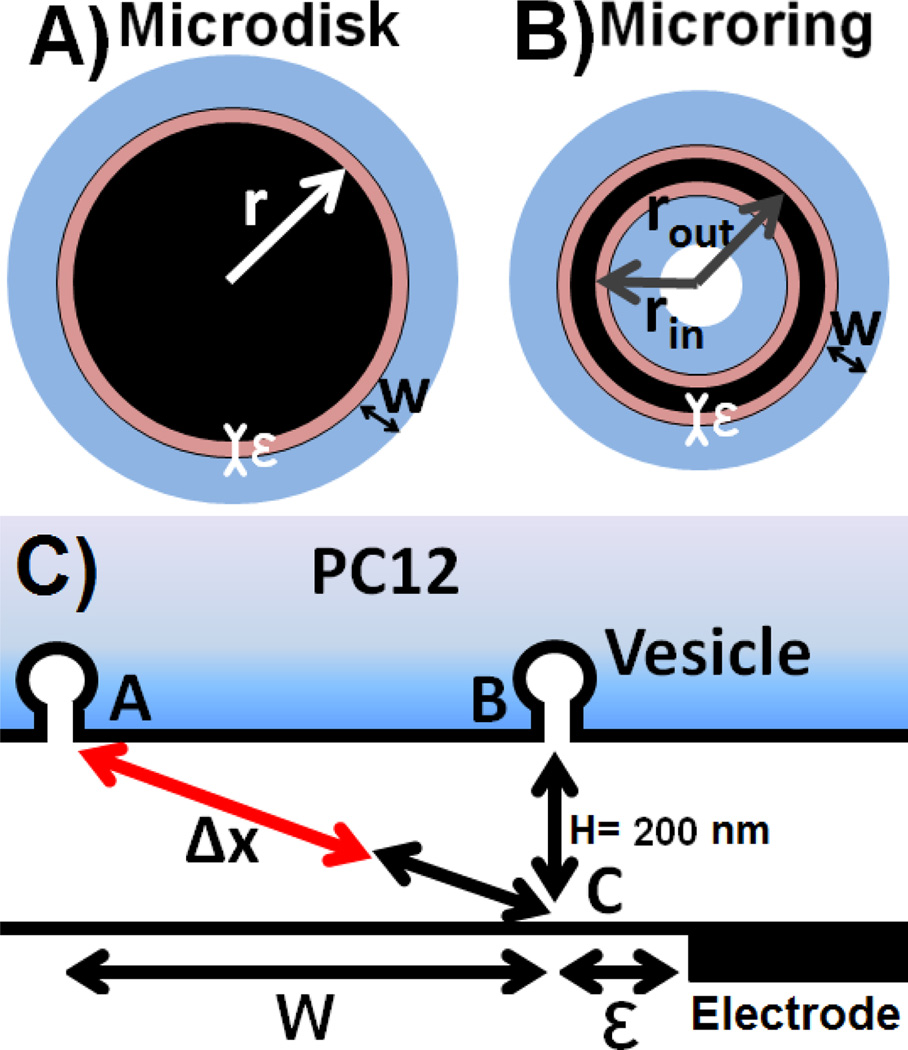
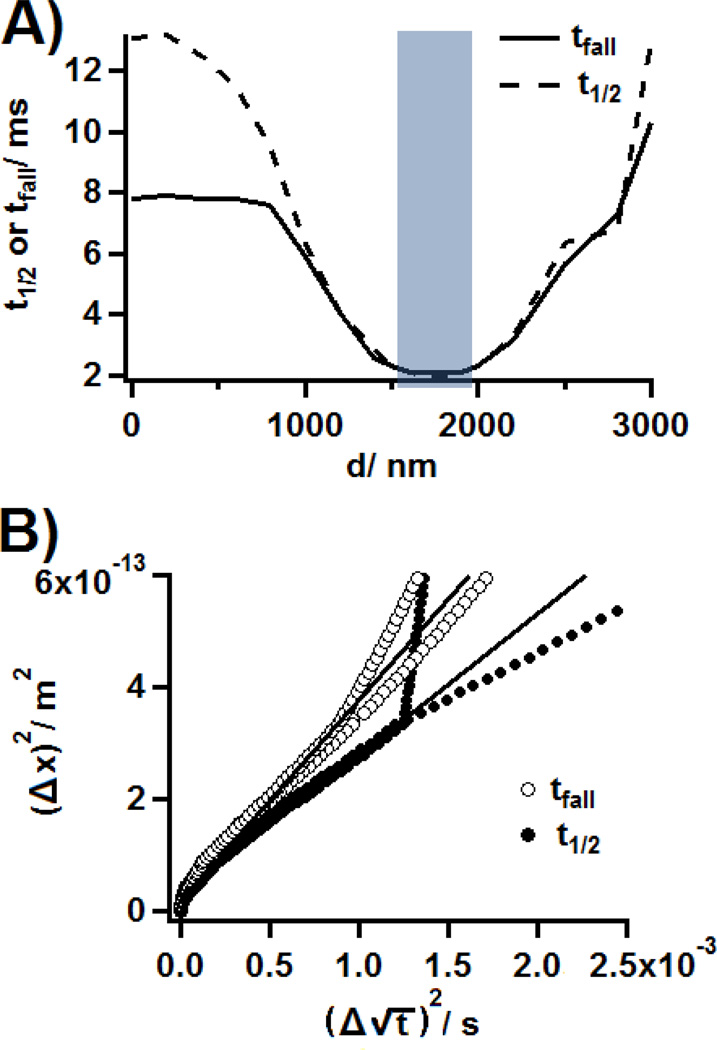
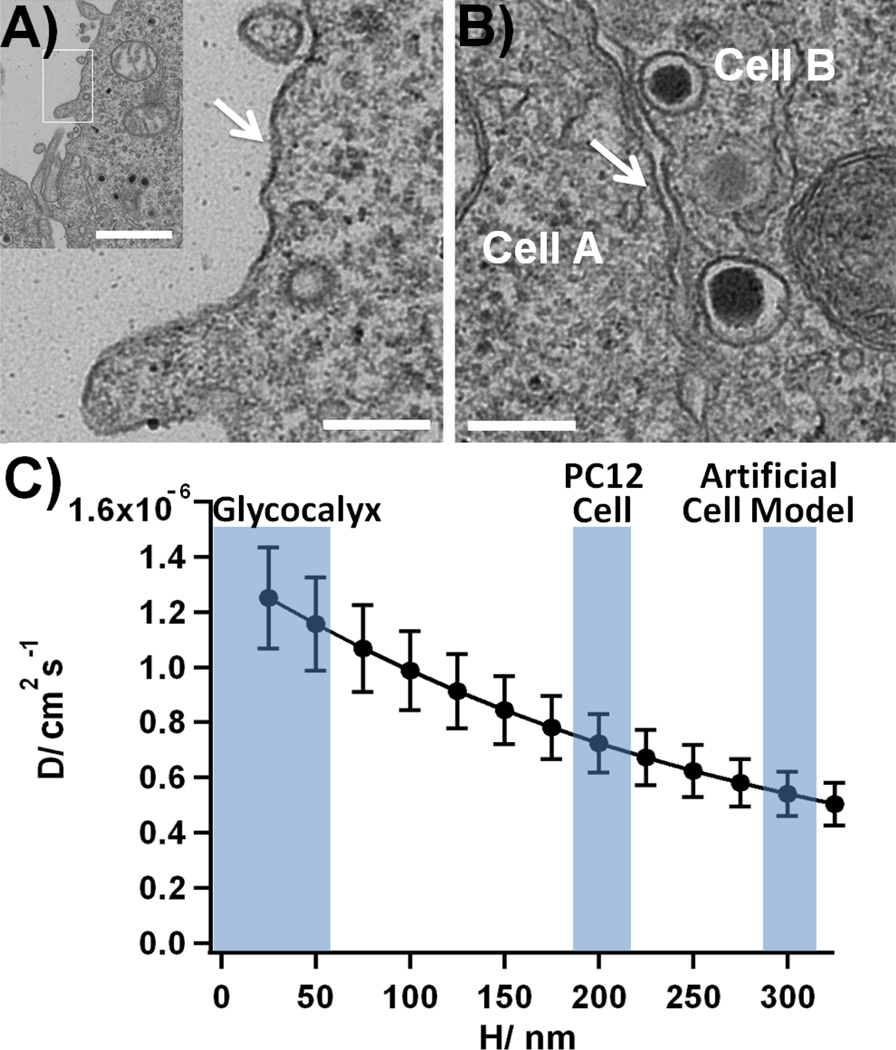
During exocytosis, small quantities of neurotransmitters are released by the cell. These neurotransmitters can be detected quantitatively using electrochemical methods, principally with disk carbon fiber microelectrode amperometry. An exocytotic event then results in the recording of a current peak whose characteristic features are directly related to the mechanisms of exocytosis. We have compared two exocytotic peak populations obtained from PC12 cells with a disk carbon fiber microelectrode and with a pyrolyzed carbon ring microelectrode array, with a 500 nm ring thickness. The specific shape of the ring electrode allows for precise analysis of diffusion processes at the vicinity of the cell membrane. Peaks obtained with a ring microelectrode array show a distorted average shape, owing to increased diffusion pathways. This result has been used to evaluate the diffusion coefficient of dopamine at the surface of a cell, which is up to an order of magnitude smaller than that measured in free buffer. The lower rate of diffusion is discussed as resulting from interactions with the glycocalyx.
Conflict of interest statement
The authors declare no competing financial interest.
Figures
Similar articles
-
Highly sensitive detection of exocytotic dopamine release using a gold-nanoparticle-network microelectrode.Anal Chem. 2011 Feb 1;83(3):920-7. doi: 10.1021/ac102599s. Epub 2010 Dec 22. Anal Chem. 2011. PMID: 21175175
-
Temporal resolution in electrochemical imaging on single PC12 cells using amperometry and voltammetry at microelectrode arrays.Anal Chem. 2011 Jan 15;83(2):571-7. doi: 10.1021/ac102502g. Epub 2010 Dec 29. Anal Chem. 2011. PMID: 21190375 Free PMC article.
-
Electrodeposited Gold on Carbon-Fiber Microelectrodes for Enhancing Amperometric Detection of Dopamine Release from Pheochromocytoma Cells.Anal Chem. 2018 Aug 21;90(16):10049-10055. doi: 10.1021/acs.analchem.8b02750. Epub 2018 Aug 6. Anal Chem. 2018. PMID: 30047726 Free PMC article.
-
Electrochemical measurement of quantal exocytosis using microchips.Pflugers Arch. 2018 Jan;470(1):97-112. doi: 10.1007/s00424-017-2063-2. Epub 2017 Sep 2. Pflugers Arch. 2018. PMID: 28866728 Free PMC article. Review.
-
Microelectrode-Based Electrochemical Sensing Technology for in Vivo Detection of Dopamine: Recent Developments and Future Prospects.Crit Rev Anal Chem. 2022;52(3):544-554. doi: 10.1080/10408347.2020.1811946. Epub 2020 Aug 27. Crit Rev Anal Chem. 2022. PMID: 32852227 Review.
Cited by
-
Organic cation transporter 3 and the dopamine transporter differentially regulate catecholamine uptake in the basolateral amygdala and nucleus accumbens.Eur J Neurosci. 2020 Dec;52(11):4546-4562. doi: 10.1111/ejn.14927. Epub 2020 Aug 19. Eur J Neurosci. 2020. PMID: 32725894 Free PMC article.
-
Location of dopamine in lipid bilayers and its relevance to neuromodulator function.Biophys J. 2023 Mar 21;122(6):1118-1129. doi: 10.1016/j.bpj.2023.02.016. Epub 2023 Feb 17. Biophys J. 2023. PMID: 36804668 Free PMC article.
-
Neurotransmitter Readily Escapes Detection at the Opposing Microelectrode Surface in Typical Amperometric Measurements of Exocytosis at Single Cells.Anal Chem. 2022 Jul 12;94(27):9548-9556. doi: 10.1021/acs.analchem.2c00060. Epub 2022 Jun 24. Anal Chem. 2022. PMID: 35750055 Free PMC article.
-
Microelectrode arrays with overlapped diffusion layers as electroanalytical detectors: theory and basic applications.Sensors (Basel). 2013 Oct 11;13(10):13659-84. doi: 10.3390/s131013659. Sensors (Basel). 2013. PMID: 24152927 Free PMC article. Review.
-
Exploiting Microelectrode Geometry for Comprehensive Detection of Individual Exocytosis Events at Single Cells.ACS Sens. 2023 Aug 25;8(8):3187-3194. doi: 10.1021/acssensors.3c00884. Epub 2023 Aug 8. ACS Sens. 2023. PMID: 37552870 Free PMC article.
References
Publication types
MeSH terms
Substances
Grants and funding
LinkOut - more resources
Full Text Sources
Other Literature Sources
