. 2013 Jun 6;153(6):1281-95.
doi: 10.1016/j.cell.2013.04.053. Epub 2013 May 23.

Architectural protein subclasses shape 3D organization of genomes during lineage commitment

Affiliations

Architectural protein subclasses shape 3D organization of genomes during lineage commitment

Jennifer E Phillips-Cremins et al. Cell. .

Abstract

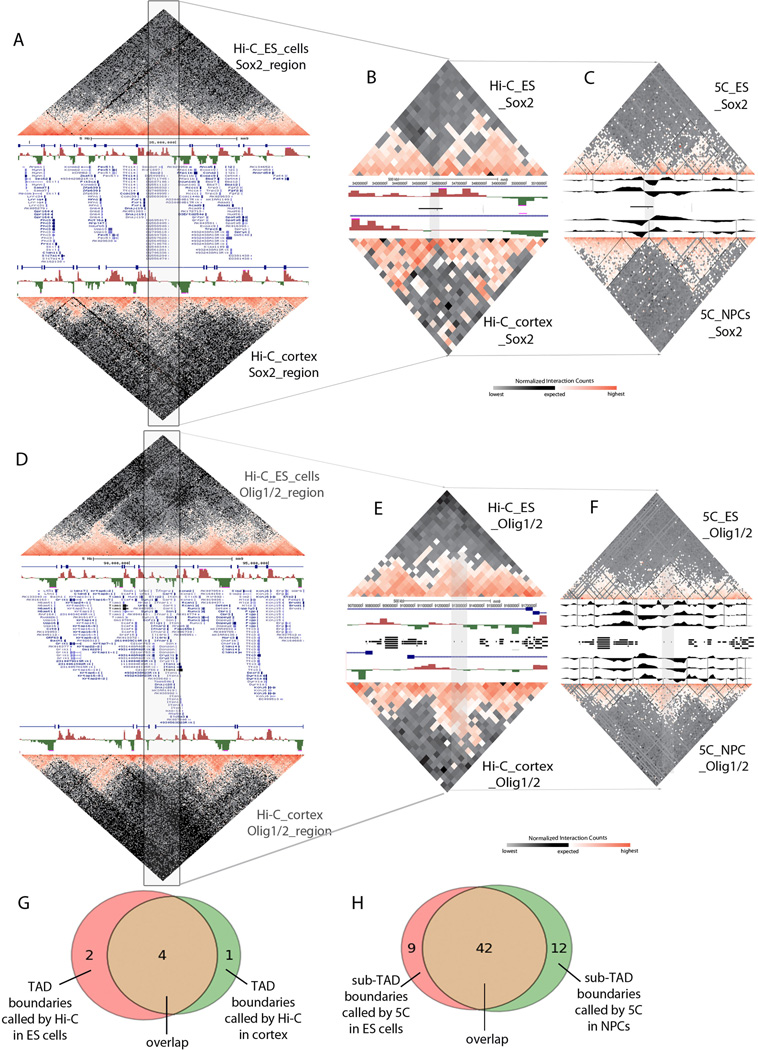
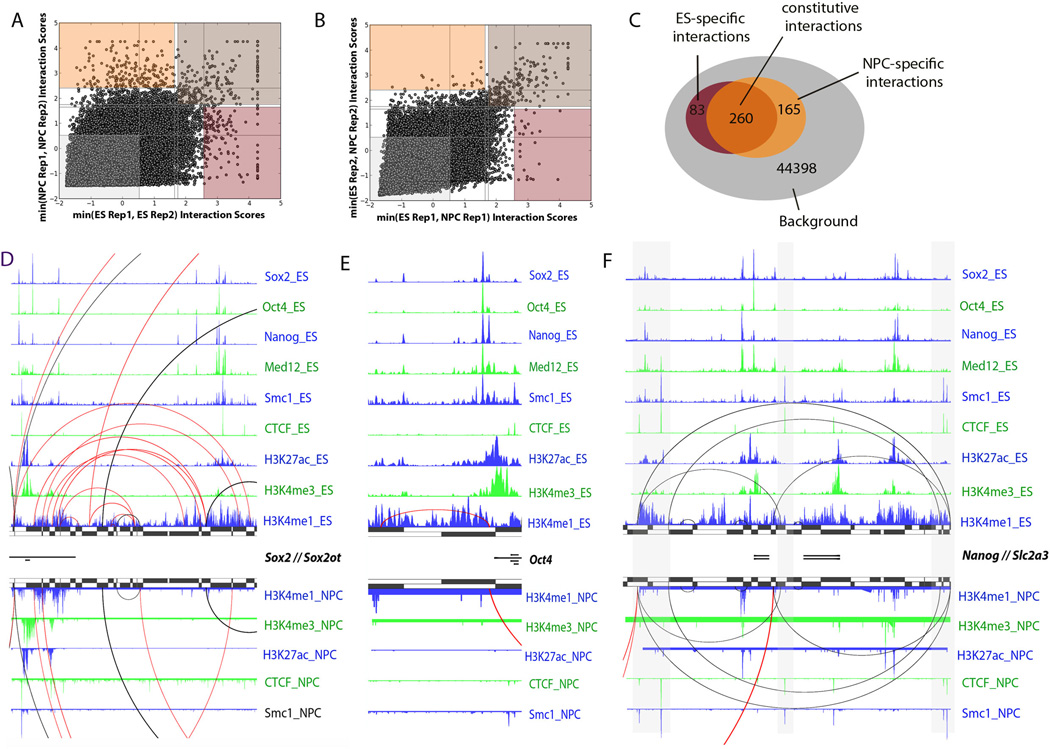
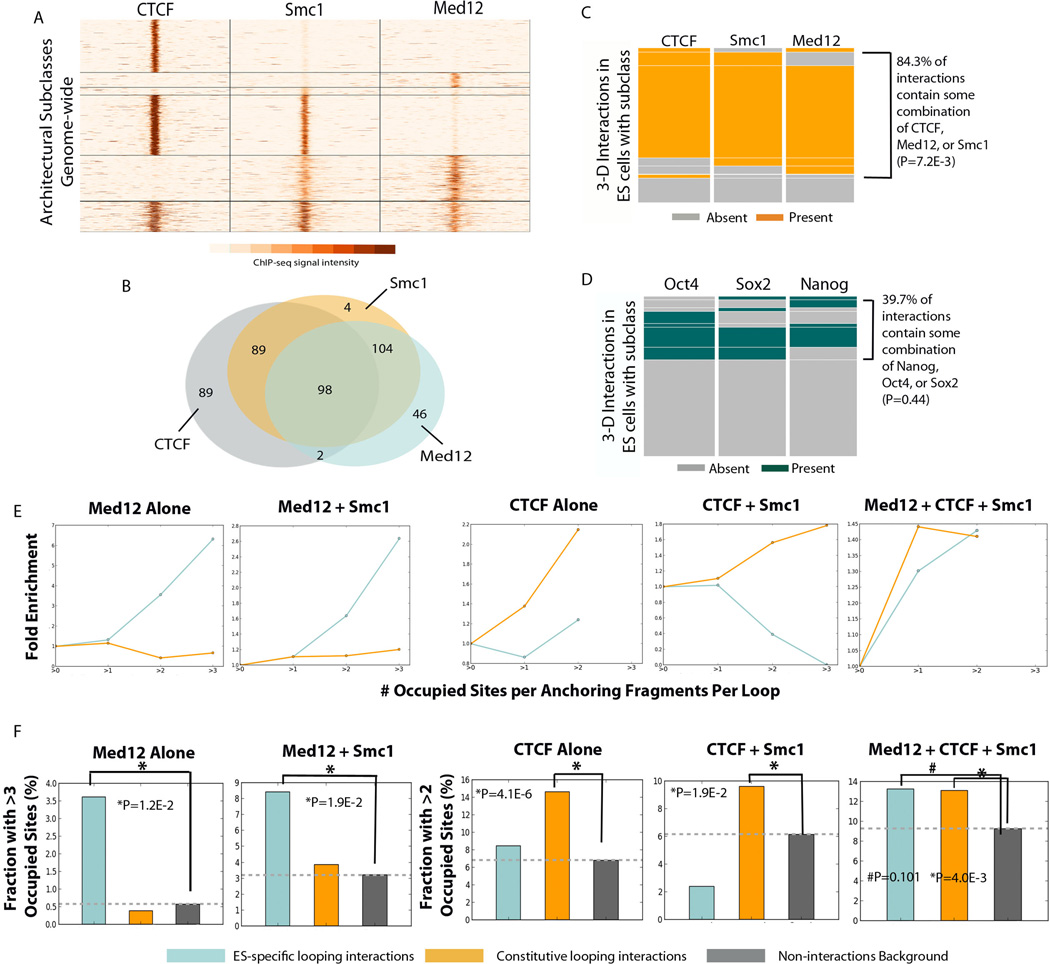
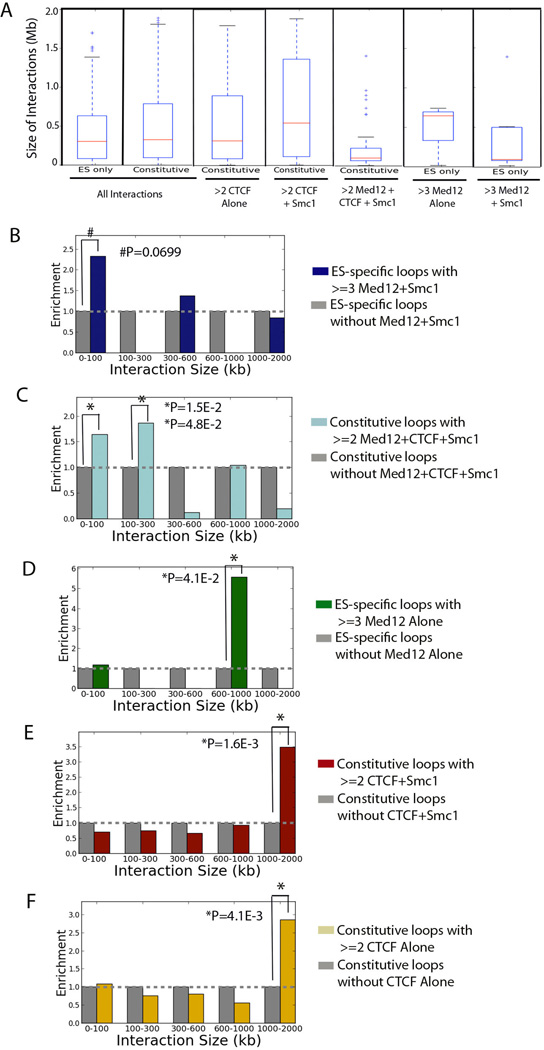
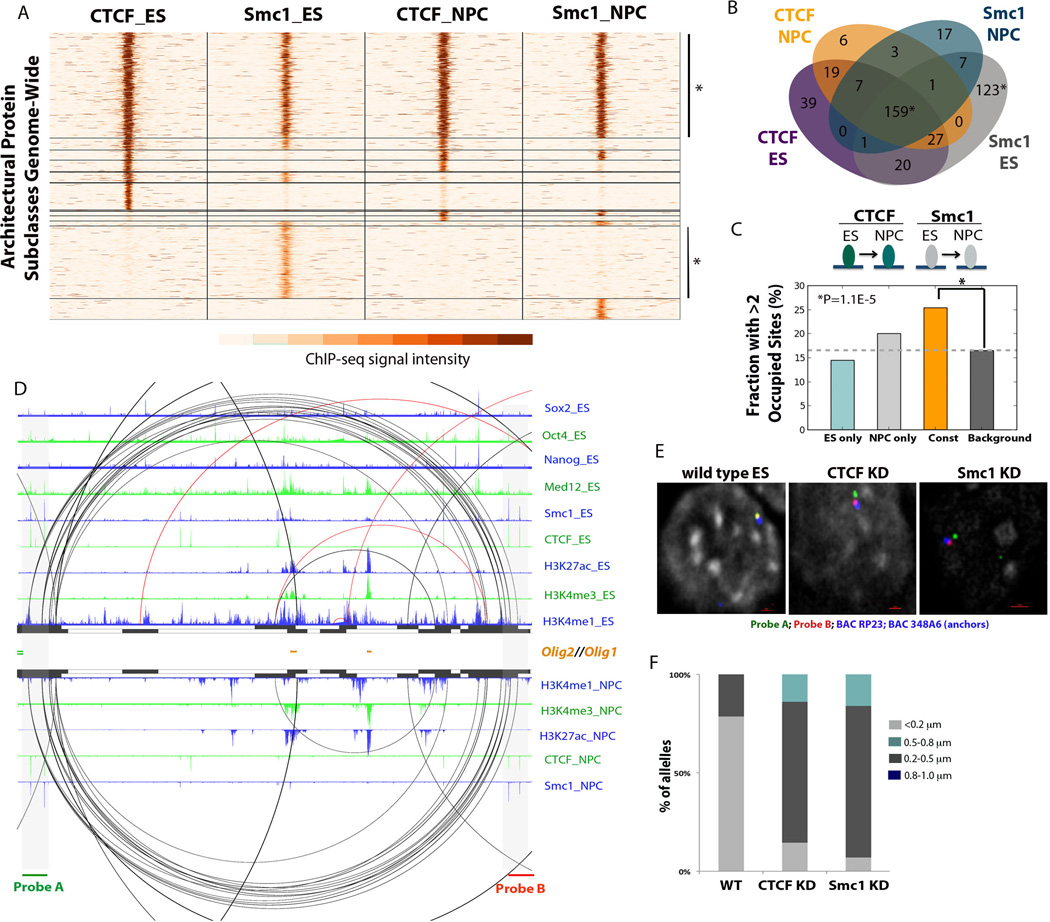
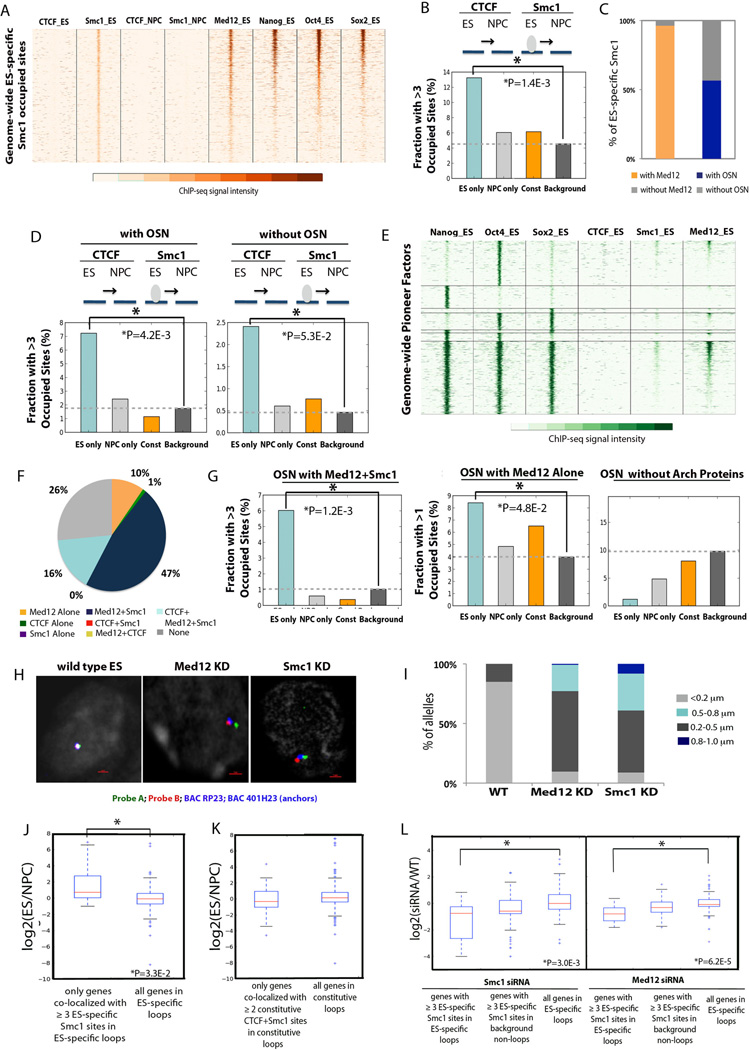
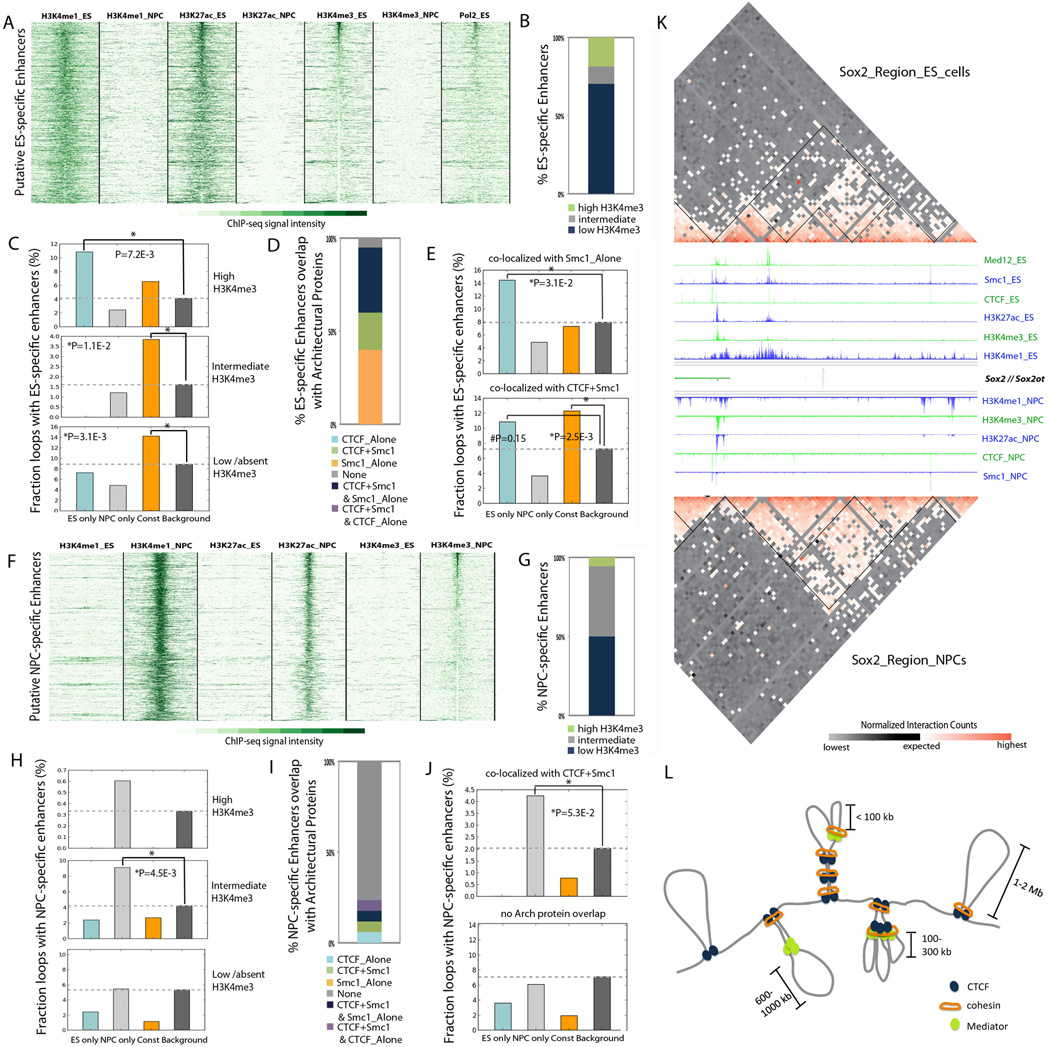
Understanding the topological configurations of chromatin may reveal valuable insights into how the genome and epigenome act in concert to control cell fate during development. Here, we generate high-resolution architecture maps across seven genomic loci in embryonic stem cells and neural progenitor cells. We observe a hierarchy of 3D interactions that undergo marked reorganization at the submegabase scale during differentiation. Distinct combinations of CCCTC-binding factor (CTCF), Mediator, and cohesin show widespread enrichment in chromatin interactions at different length scales. CTCF/cohesin anchor long-range constitutive interactions that might form the topological basis for invariant subdomains. Conversely, Mediator/cohesin bridge short-range enhancer-promoter interactions within and between larger subdomains. Knockdown of Smc1 or Med12 in embryonic stem cells results in disruption of spatial architecture and downregulation of genes found in cohesin-mediated interactions. We conclude that cell-type-specific chromatin organization occurs at the submegabase scale and that architectural proteins shape the genome in hierarchical length scales.


Figures

Figure 1
Figure 1. High-resolution mapping reveals a hierarchy of architectural subdomains within larger topological domains
(A–F) 5C and Hi-C interaction frequencies represented as normalized two-dimensional heat maps. (A,B,D,E) Hi-C data (adapted from (Dixon et al., 2012)) displayed for (A,D) 10 Mb and (B,E) 1 Mb regions around (A,B)Sox2 and (D,E)Olig1-Olig2 for mouse E14 ES cells (top) and mouse cortex (bottom). TADs reported in (Dixon et al., 2012) are represented as tracks for domain calls (blue bars) and directionality index (downstream bias (green), upstream bias (red)). (C, F) 5C data displayed for 1 Mb regions around (C)Sox2 and (F) Olig1-Olig2 for mouse V6.5 ES cells (top) and ES-derived NPCs (bottom). Constitutive and cell type-specific sub-domains called with our Hidden Markov Model (see Extended Experimental Procedures) are represented as black lines overlaid on 5C heatmaps and a directionality index displayed as a hierarchy of black wiggle tracks. (G, H) Overlap between cell types for (G) TAD boundaries called from Hi-C data in (Dixon et al., 2012) and (H) sub-domain boundaries called from 5C data.
Figure 2
Figure 2. Genome architecture undergoes marked reorganization at the sub-Mb scale upon differentiation
(A) Scatterplot comparison of interaction scores between ES cells and NPCs. Thresholds for constitutive and cell type-specific looping interactions are represented as colored boxes (brown, constitutive; red, ES-specific; orange, NPC-specific; grey, background). (B) Scatterplot comparison of interaction scores after randomly permuting replicates. (C) Interactions called significant in ES cells and NPCs. (D–F) Chromatin interactions and epigenetic modifications at specific genomic loci in ES cells and NPCs. ChIP-seq reads are displayed for CTCF, Med12, Smc1, Sox2, Oct4, Nanog, H3K27Ac, H3K4me1, and H3K4me3 in ES cells (above gene track) and CTCF, Smc1, H3K27Ac, H3K4me1, and H3K4me3 in NPCs (below gene track). 3-D interactions are represented as mirror image arcplots for ES cells (above gene track) and NPCs (below gene track), with constitutive and cell type-specific interactions displayed in black and red, respectively. Black bars represent HindIII restriction fragments. (D) ES-specific interactions between Sox2 and a putative enhancer. (E) ES-specific interactions between Oct4 and a putative enhancer. (F) Constitutive interactions around Nanog and Slc2a3.
Figure 3
Figure 3. Architectural protein subclasses have distinct roles in genome organization
(A) Heatmap representation of ChIP-seq signal for seven distinct architectural protein subclasses genome-wide. (B) Venn diagram comparing binding patterns for high-confidence (P<1×10⁻⁸) CTCF, Med12, and Smc1 occupied sites in 5C regions. (C–D) Unsupervised hierarchical clustering for significant interactions in ES cells enriched for (C) CTCF, Med12, Smc1 or (D) Oct4, Nanog, Sox2. (E) Fold enrichment of architectural protein subclasses in looping interactions vs. the number of occupied sites per anchoring fragments. (F) Fraction of constitutive or ES-specific looping interactions enriched with architectural protein occupied sites compared to the expected enrichment in background. Fisher’s Exact test: *, P<=0.05.
Figure 4
Figure 4. Architectural protein subclasses function at different length scales
(A) Size distributions of looping interactions mediated by distinct subclasses of architectural proteins. (B–F) Histograms binned by loop size displaying fold enrichment of interactions connected by (B) Med12+Smc1 (navy), (C) Med12+CTCF+Smc1 (light blue), (D) Med12 alone (green), (E) CTCF+Smc1 (red), or (F) CTCF alone (orange) compared to all interactions not containing the occupied sites in ES cells (gray). Fisher’s Exact test: *, P<=0.05.
Figure 5
Figure 5. Constitutive looping interactions are anchored by constitutive binding of CTCF and cohesin
(A) Heatmap representation of distinct subclasses of architectural protein occupancy between cell types genome-wide. (B) Venn diagram representing unique and overlapping high-confidence (P<1×10⁻⁸) CTCF and Smc1 occupied sites in ES cells and ES-derived NPCs in 5C regions. (C) Fraction of constitutive or cell type-specific looping interactions enriched with constitutive occupancy of CTCF+Smc1 compared to the expected background enrichment. Fisher’s Exact test: *, P<=0.05. (D–F) DNA FISH analysis of chromatin interactions connected by sites constitutively bound by CTCF+Smc1. (D) Arcplot of constitutive interactions anchored by constitutive CTCF+Smc1 occupied sites (black) and cell type-specific interactions anchored by ES-specific Smc1 occupied sites (red) compared to epigenetic marks around Olig1 and Olig2 genes. Shaded grey bars highlight genomic fragments constitutively bound by dual CTCF+Smc1 sites anchoring the base of a series of constitutive looping interactions. (E) Probes specific for fragment A (green) and fragment B (red) were used to perform DNA FISH in wild type V6.5 ES cells and ES cells treated with lentiviral shRNA for CTCF or Smc1. Scale bar, 1 µm. (F) Quantification of spatial distances separating FISH probes (mean ± s.d.). Wild type V6.5 ES cells (0.144 ± 0.05 µm, n=126), CTCF knock-down (0.421 ± 0.21 µm, n=130), and Smc1 knock-down (0.385 ± 0.13 µm, n=113).
Figure 6
Figure 6. Mediator and cohesin bridge ES-specific enhancer-promoter interactions
(A) Heatmap representation of all ES-specific Smc1 occupied sites compared to Med12, Oct4, Sox2, and Nanog occupied sites genome-wide. (B) Fraction of constitutive or cell type-specific looping interactions enriched with ES-specific Smc1 occupied sites compared to the expected background enrichment. Fisher’s Exact test: *, P<=0.05. (C) Fraction of ES-specific Smc1 occupied sites co-localized with Med12 or Oct4/Sox2/Nanog in 5C regions. (D) Fraction of constitutive or cell type-specific looping interactions enriched with ES-specific Smc1 occupied sites with or without Oct4/Sox2/Nanog compared to the expected enrichment in background. Fisher’s Exact test: *, P<=0.05. (E) Heatmap representation of all Oct4/Sox2/Nanog subclasses compared to architectural proteins sorted by Med12 occupancy genome-wide. (F) Pie chart showing percentages of Oct4/Sox2/Nanog occupied sites co-localized with architectural proteins in 5C regions (n=102). (G) Fraction of constitutive or cell type-specific looping interactions enriched with Oct/Sox2/Nanog with or without architectural proteins compared to the expected enrichment in background. Fisher’s Exact test: *, P<=0.05. (H) Probes specific for fragment A (green) and fragment B (red) anchoring an ES-specific looping interaction connected by an ES-specific cohesin site were used to perform DNA FISH in wild type V6.5 ES cells and ES cells treated with shRNA for Med12 or Smc1. Scale bar, 1 µm. (I) Quantification of spatial distances separating FISH probes (mean ± s.d.). Wild type V6.5 ES cells (0.139 ± 0.04 µm, n=114), Med12 knockdown (0.390 ± 0.16 µm, n=123), and Smc1 knock-down (0.462 ± 0.21 µm, n=123). (J–K) Gene expression ratio between ES cells and NPCs for (J) genes in ES-specific interactions co-localized with ES-specific Smc1 compared to all genes in ES-specific interactions or (K) genes in constitutive interactions co-localized with constitutive CTCF+cohesin compared to all genes in constitutive interactions. (L) Gene expression ratio between siRNA-treatment for Med12 or Smc1 and wild type ES cells for genes in ES-specific interactions co-localized with ES-specific Smc1 compared to either all genes in ES-specific interactions or all genes co-localized with Smc1 in background non-interactions. Kolmogorov-Smirnov test: *, P<=0.05.
Figure 7
Figure 7. Architectural proteins cooperate with cell type-specific enhancers to form cell type-specific interactions
(A) Heatmap representation of chromatin modifications demarcating putative ES-specific enhancers genome-wide. (B) Fraction of ES-specific enhancers co-localized with high, intermediate, or low levels of H3K4me3 in 5C regions. (C) Fraction of constitutive or cell type-specific looping interactions enriched with ES-specific enhancers with high, intermediate, or low levels of H3K4me3 compared to the expected background enrichment. Fisher’s Exact test: *, P<=0.05. (D) Fraction of ES-specific enhancers co-localized with architectural proteins in 5C regions. (E) Fraction of constitutive or cell type-specific looping interactions enriched with ES-specific enhancers co-localized with Smc1 Alone or CTCF+Smc1 compared to the expected enrichment in background. Fisher’s Exact test: *, P<=0.05. (F) Heatmap representation of chromatin modifications demarcating putative NPC-specific enhancers genome-wide. (G) Fraction of NPC-specific enhancers co-localized with high, intermediate, or low levels of H3K4me3 in 5C regions. (H) Fraction of constitutive or cell type-specific looping interactions enriched with NPC-specific enhancers co-localized with high, intermediate, or low levels of H3K4me3 compared to the expected background enrichment. Fisher’s Exact test: *, P<=0.05. (I) Fraction of NPC-specific enhancers co-localized with architectural proteins in 5C regions. (J) Fraction of constitutive or cell type-specific looping interactions enriched with NPC-specific enhancers co-localized with CTCF+Smc1 or without architectural proteins compared to the expected enrichment in background. Fisher’s Exact test: *, P<=0.05. (K) 5C interaction frequencies and epigenetic modifications at the Sox2 locus in ES cells (above gene track) and NPCs (below gene track). (L) Architectural length scale model for developmentally regulated chromatin organization.

Comment in

References

    1. Cremer T, Cremer C. Chromosome territories, nuclear architecture and gene regulation in mammalian cells. Nat Rev Genet. 2001;2:292–301. - PubMed
    1. Creyghton MP, Cheng AW, Welstead GG, Kooistra T, Carey BW, Steine EJ, Hanna J, Lodato MA, Frampton GM, Sharp PA, et al. Histone H3K27ac separates active from poised enhancers and predicts developmental state. Proc Natl Acad Sci U S A. 2010;107:21931–21936. - PMC - PubMed
    1. Dekker J, Rippe K, Dekker M, Kleckner N. Capturing chromosome conformation. Science. 2002;295:1306–1311. - PubMed
    1. Dixon JR, Selvaraj S, Yue F, Kim A, Li Y, Shen Y, Hu M, Liu JS, Ren B. Topological domains in mammalian genomes identified by analysis of chromatin interactions. Nature. 2012;485:376–380. - PMC - PubMed
    1. Dostie J, Richmond TA, Arnaout RA, Selzer RR, Lee WL, Honan TA, Rubio ED, Krumm A, Lamb J, Nusbaum C, et al. Chromosome Conformation Capture Carbon Copy (5C): a massively parallel solution for mapping interactions between genomic elements. Genome Res. 2006;16:1299–1309. - PMC - PubMed

Publication types

MeSH terms

Associated data