Review
. 2013 May 23;20(5):660-6.
doi: 10.1016/j.chembiol.2013.05.001.

iPOP goes the world: integrated personalized Omics profiling and the road toward improved health care

Affiliations
Review

iPOP goes the world: integrated personalized Omics profiling and the road toward improved health care

Jennifer Li-Pook-Than et al. Chem Biol. .

Abstract

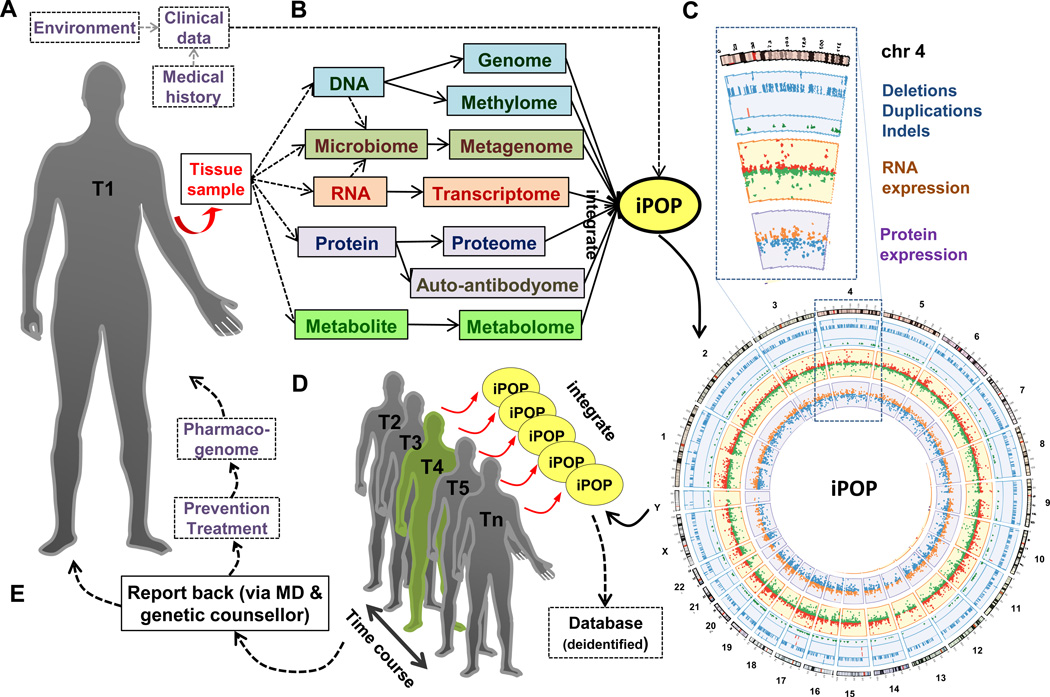
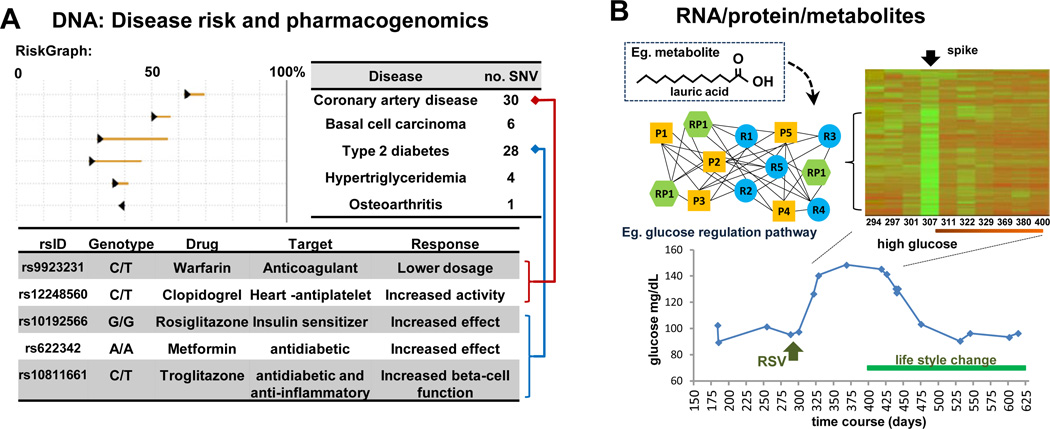
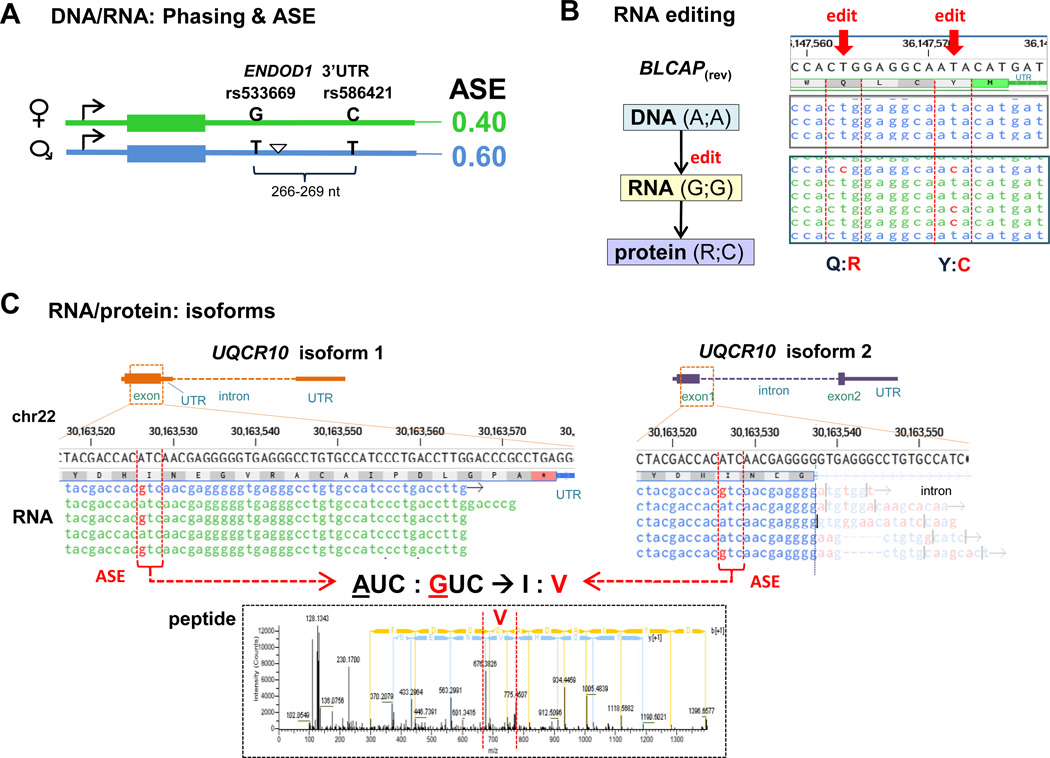
The health of an individual depends upon their DNA as well as upon environmental factors (environome or exposome). It is expected that although the genome is the blueprint of an individual, its analysis with that of the other omes such as the DNA methylome, the transcriptome, proteome, and metabolome will further provide a dynamic assessment of the physiology and health state of an individual. This review will help to categorize the current progress of omics analyses and how omics integration can be used for medical research. We believe that integrative personal omics profiling (iPOP) is a stepping stone to a new road to personalized health care and may improve disease risk assessment, accuracy of diagnosis, disease monitoring, targeted treatments, and understanding the biological processes of disease states for their prevention.


Conflict of interest statement

J.L.P.T declares no conflict of interest.

Figures

Figure 1
Figure 1. Schematic representing the implementation of iPOP for personalized medicine
(A) Participant tissue sample (e.g. PBMC) is collected, while environment (incl. diet, exercise, etc.), medical history and clinical data are recorded. T1 is the first time point. (B) Selected omic analysis involved in a sample iPOP study (Chen et al., 2012). (C) Sample Circos plot (Krzywinski et al., 2009) of DNA (outer ring), RNA (middle ring) and protein (inner ring) data matching to chromosomes. (D) iPOP performed and integrated at multiple time points: T2, T3, T4 (viral-infected), T5 up to Tn states, including disease-state(s). Grey and green forms represent relative-healthy individual and a disease-state, respectively. (E) Report data back to genetic counsellor and medical practitioner with better informed choices for prevention and/or treatment (matched with pharmacogenetic data), if needed.
Figure 2
Figure 2. Highlights in iPOP
(A) Integration of DNA variants to assess disease risk (RiskGraph, top panel) and a sample pharmacogenome (bottom panel). Arrow heads point in the direction of the change in post-test probability (%). (B) Expression analysis (partial heatmap) of the transriptome and proteome over a time course spanning a respiratory syncytial viral (RSV) infection, with glucose monitoring (bottom, onset of T2D). Genes showing relative change in expression are clustered and represented as a network of inter- and intra-connected pathways: RNA (blue circle), protein (yellow square) and both RNA and protein (green hexagon). An example of a metabolite identified during the time course (inset panel).
Figure 3
Figure 3. Highlights in iPOP
(A) Sample phased DNA overlaid with RNA variant data corroborated with allelic specific expression (ASE) ratios for the ENDOD1 gene. Maternal transcript is expressed at 0.40, while the respective paternal transcript is expressed at 0.60. The triangle represents an indel in the paternally inherited transcript. (B) RNA editing in BLCAP (red arrows) result in protein level amino acid changes. BLCAP is found on the reverse strand (rev), and A→G editing appear as T→C. (C) An example of the diversity of isoforms observed in UQCR10 RNA and protein data. The two isoforms each contain the allelic specific variant A and G (rs76013375). Note isoform 2 spans into the intron position of DNA (faded); the true match is at the alternate spliced region located further downstream (not shown). RNA variant (A/G) results in amino acid change I:V, as identified in proteome mass spectrometric data (bottom). For (B) and (C), DNAnexus was used as a genome browser, where red nucleic acid represents mis-matches to reference genome (top). Blue and green nucleic acid strands represent forward and reverse Illumina reads, respectively.

References

    1. Abecasis GR, Altshuler D, Auton A, Brooks LD, Durbin RM, Gibbs Ra, Hurles ME, et al. A map of human genome variation from population-scale sequencing. Nature. 2010;467(7319):1061–1073. - PMC - PubMed
    1. Ashley EA, Butte AJ, Wheeler MT, Chen R, Klein TE, Dewey FE, Dudley JT, et al. Clinical assessment incorporating a personal genome. Lancet. 2010;375(9725):1525–1535. - PMC - PubMed
    1. Beadle GW, Tatum EL. Genetic control of biochemical reactions in Neurospora. Proc. Natl. Acad. Sci. USA. 1941;27(11):499–506. - PMC - PubMed
    1. Birney E, Stamatoyannopoulos Ja, Dutta A, Guigó R, Gingeras TR, Margulies EH, Weng Z, et al. Identification and analysis of functional elements in 1% of the human genome by the ENCODE pilot project. Nature. 2007;447(7146):799–816. - PMC - PubMed
    1. Boyle AP, Hong EL, Hariharan M, Cheng Y, Schaub MA, Kasowski M, Karczewski KJ, et al. Annotation of functional variation in personal genomes using RegulomeDB. Genome Res. 2012;22:1790–1797. - PMC - PubMed