Preconditioning diabetic mesenchymal stem cells with myogenic medium increases their ability to repair diabetic heart
- PMID: 23706645
- PMCID: PMC3707006
- DOI: 10.1186/scrt207
Preconditioning diabetic mesenchymal stem cells with myogenic medium increases their ability to repair diabetic heart
Abstract
Introduction: Mesenchymal stem cells (MSCs) have the potential for treatment of diabetic cardiomyopathy; however, the repair capability of MSCs declines with age and disease. MSCs from diabetic animals exhibit impaired survival, proliferation, and differentiation and therefore require a strategy to improve their function. The aim of the study was to develop a preconditioning strategy to augment the ability of MSCs from diabetes patients to repair the diabetic heart.
Methods: Diabetes was induced in C57BL/6 mice (6 to 8 weeks) with streptozotocin injections (55 mg/kg) for 5 consecutive days. MSCs isolated from diabetic animals were preconditioned with medium from cardiomyocytes exposed to oxidative stress and high glucose (HG/H-CCM).
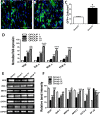
Results: Gene expression of VEGF, ANG-1, GATA-4, NKx2.5 MEF2c, PCNA, and eNOS was upregulated after preconditioning with HG/H-CCM, as evidenced by reverse transcriptase/polymerase chain reaction (RT-PCR). Concurrently, increased AKT phosphorylation, proliferation, angiogenic ability, and reduced levels of apoptosis were observed in HG/H-CCM-preconditioned diabetic MSCs compared with nontreated controls. HG/H-CCM-preconditioned diabetic-mouse-derived MSCs (dmMSCs) were transplanted in diabetic animals and demonstrated increased homing concomitant with augmented heart function. Gene expression of angiogenic and cardiac markers was significantly upregulated in conjunction with paracrine factors (IGF-1, HGF, SDF-1, FGF-2) and, in addition, reduced fibrosis, apoptosis, and increased angiogenesis was observed in diabetic hearts 4 weeks after transplantation of preconditioned dmMSCs compared with hearts with nontreated diabetic MSCs.
Conclusions: Preconditioning with HG/H-CCM enhances survival, proliferation, and the angiogenic ability of dmMSCs, augmenting their ability to improve function in a diabetic heart.
Figures


Similar articles
-
Diazoxide preconditioning of endothelial progenitor cells from streptozotocin-induced type 1 diabetic rats improves their ability to repair diabetic cardiomyopathy.Mol Cell Biochem. 2015 Dec;410(1-2):267-79. doi: 10.1007/s11010-015-2560-6. Epub 2015 Sep 10. Mol Cell Biochem. 2015. PMID: 26359087
-
Growth factor preconditioning increases the function of diabetes-impaired mesenchymal stem cells.Stem Cells Dev. 2011 Jan;20(1):67-75. doi: 10.1089/scd.2009.0397. Epub 2010 Oct 12. Stem Cells Dev. 2011. PMID: 20446810
-
Metformin impairs homing ability and efficacy of mesenchymal stem cells for cardiac repair in streptozotocin-induced diabetic cardiomyopathy in rats.Am J Physiol Heart Circ Physiol. 2021 Apr 1;320(4):H1290-H1302. doi: 10.1152/ajpheart.00317.2020. Epub 2021 Jan 29. Am J Physiol Heart Circ Physiol. 2021. PMID: 33513084
-
Effects of mesenchymal stromal cells on diabetic cardiomyopathy.Curr Pharm Des. 2011 Oct;17(30):3341-7. doi: 10.2174/138161211797904163. Curr Pharm Des. 2011. PMID: 21919875 Review.
-
Preconditioned Mesenchymal Stromal Cells to Improve Allotransplantation Outcome.Cells. 2021 Sep 6;10(9):2325. doi: 10.3390/cells10092325. Cells. 2021. PMID: 34571974 Free PMC article. Review.
Cited by
-
Priming approaches to improve the efficacy of mesenchymal stromal cell-based therapies.Stem Cell Res Ther. 2019 May 2;10(1):131. doi: 10.1186/s13287-019-1224-y. Stem Cell Res Ther. 2019. PMID: 31046833 Free PMC article. Review.
-
Current status and new horizons in stem cell therapy in cardiovascular regenerative medicine (CaVaReM): an update.Eur J Med Res. 2025 Sep 3;30(1):837. doi: 10.1186/s40001-025-03018-z. Eur J Med Res. 2025. PMID: 40903743 Free PMC article. Review.
-
Role of mesenchymal stem cell-derived exosomes in the regeneration of different tissues.J Biol Eng. 2024 Jun 6;18(1):36. doi: 10.1186/s13036-024-00431-6. J Biol Eng. 2024. PMID: 38845032 Free PMC article. Review.
-
Umbilical Cord-Derived Mesenchymal Stem Cells Are Able to Use bFGF Treatment and Represent a Superb Tool for Immunosuppressive Clinical Applications.Int J Mol Sci. 2020 Jul 28;21(15):5366. doi: 10.3390/ijms21155366. Int J Mol Sci. 2020. PMID: 32731615 Free PMC article.
-
Challenges and advances in clinical applications of mesenchymal stromal cells.J Hematol Oncol. 2021 Feb 12;14(1):24. doi: 10.1186/s13045-021-01037-x. J Hematol Oncol. 2021. PMID: 33579329 Free PMC article. Review.
References
Publication types
MeSH terms
Substances
LinkOut - more resources
Full Text Sources
Other Literature Sources
Medical
Miscellaneous

