. 2013 May 23;153(5):988-99.
doi: 10.1016/j.cell.2013.04.033.

Global regulation of promoter melting in naive lymphocytes

Affiliations

Global regulation of promoter melting in naive lymphocytes

Fedor Kouzine et al. Cell. .

Abstract

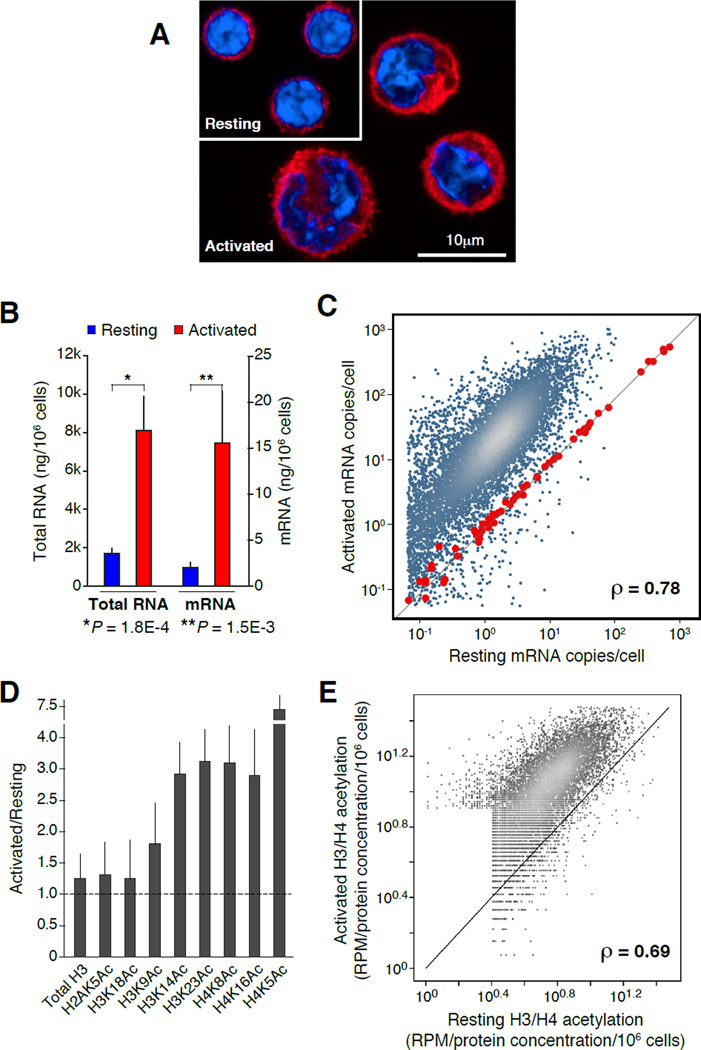
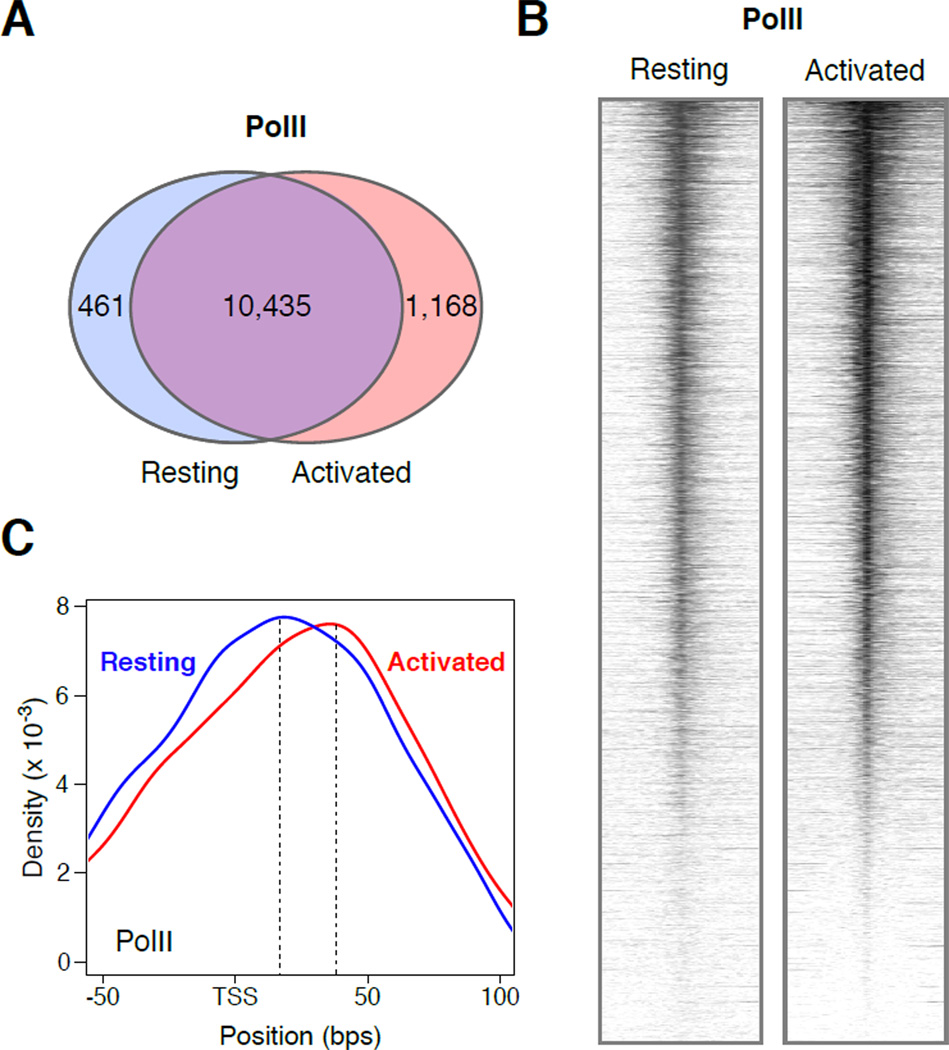
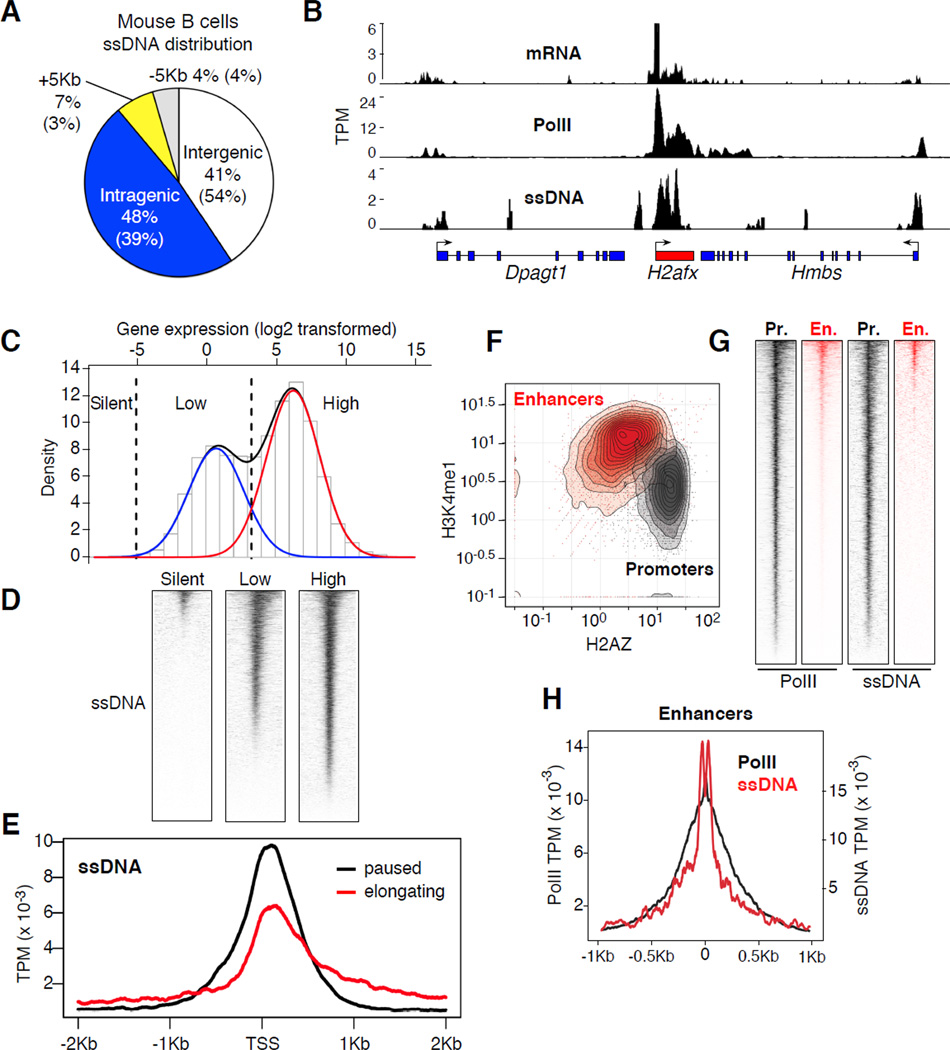
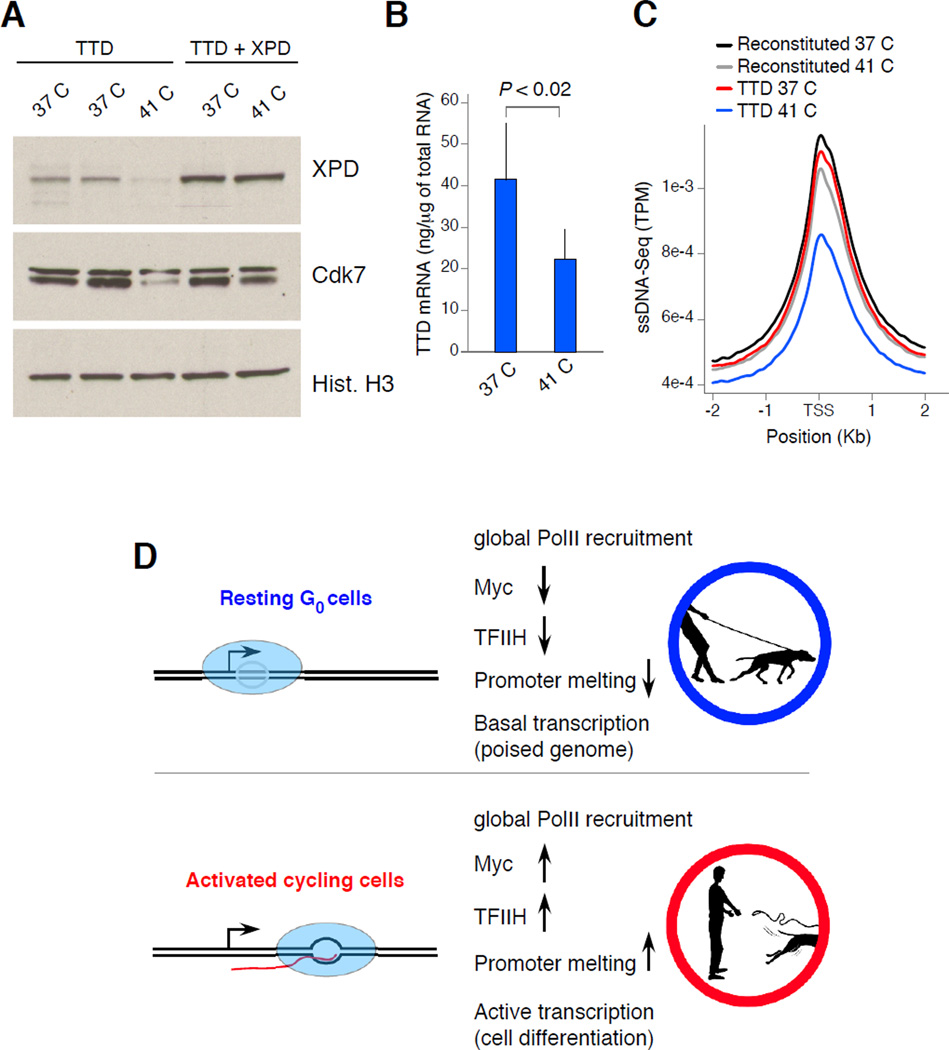
Lymphocyte activation is initiated by a global increase in messenger RNA synthesis. However, the mechanisms driving transcriptome amplification during the immune response are unknown. By monitoring single-stranded DNA genome wide, we show that the genome of naive cells is poised for rapid activation. In G0, ∼90% of promoters from genes to be expressed in cycling lymphocytes are polymerase loaded but unmelted and support only basal transcription. Furthermore, the transition from abortive to productive elongation is kinetically limiting, causing polymerases to accumulate nearer to transcription start sites. Resting lymphocytes also limit the expression of the transcription factor IIH complex, including XPB and XPD helicases involved in promoter melting and open complex extension. To date, two rate-limiting steps have been shown to control global gene expression in eukaryotes: preinitiation complex assembly and polymerase pausing. Our studies identify promoter melting as a third key regulatory step and propose that this mechanism ensures a prompt lymphocyte response to invading pathogens.


Figures

Figure 1
Figure 1. Proportional upregulation of mRNA synthesis and histone acetylation during B cell activation
(A) Confocal micrograph showing representative examples of resting (G0) and activated (cycling plasmacytes) B cells. Samples were stained with anti-β-tubulin (red) and DAPI (blue). (B) Bar graph portraying total RNA (isolated with TRIzol reagent) and mRNA (isolated with oligo(dT) microbeads) from resting (blue bars) and activated (red bars) B lymphocytes (measured as ng/106 cells). Data are represented as mean +/− SEM (n = 4). (C) Comparison of resting and activated B cell transcriptomes, as determined by mRNA-Seq analysis. Values represent mRNA copies per cell, calculated based on mRNA standards (red dots) spiked-in to total RNA isolated from 106 resting or activated B cells. (D) Reverse phase protein microarray analysis of histone H3 and H4 lysine acetylation marks during B cell activation. Bars represent the ratio of total acetylation measured in activated versus naïve cells. Total histone H3 was used as “loading” control. Data are represented as mean +/− SEM (n = 4). (E) Comparison of histone H3 (K14, K23) and H4 (K5, K8, K16) acetylation in resting and activated B cells as measured by ChIP-Seq and normalized using RPMA values (panel D). Correlation in panels C and E was calculated via Spearman’s ρ.
Figure 2
Figure 2. PolII recruitment and promoter profiles during B cell activation
(A) Venn diagram showing the number of genes in resting (blue circle) and stimulated (red circle) B cells are associated with PolII ChIP-seq signals. (B) Heat map plots of PolII recruitment at Ensembl mouse genes (+/− 2Kb) from resting and activated B cells. (C) Density graph showing PolII occupancy near TSSs in G0 (blue line) and cycling B cells (red line). The upper value of the composite dataset is shown with a dotted line. Resting maximal PolII average density = 16bps from TSS. Activated maximal = 34bps.
Figure 3
Figure 3. ssDNA-Seq approach and validation
(A) During ssDNA-Seq ssDNA is stabilized in live cells by treatment with KMnO4, which selectively oxidizes exposed thymidines. Cordycepin and TdT are used to block pre-existing 3’ DNA free ends and ssDNA is digested with mung bean nuclease. DNA ends exposed by nuclease treatment are then biotinylated and, following sonication, streptavidin selected and deep sequenced. (B) Distribution of ssDNA signals in Raji cells. +5Kb and −5Kb represent ssDNA signals aligning within 5Kb upstream of TSS or downstream of gene stop codons respectively. Numbers in parenthesis are expected percentages if reads were randomly distributed. (C) Composite diagram showing ssDNA and PolII signals around TSSs of human genes in Raji cells. (D) Composite diagrams showing the distribution of 5’ (blue) and 3’ (red) ssDNA-Seq tags around SIDDs predicted for the mouse genome. (E) Deep-sequencing profiles at mouse SIDDs obtained with anti-PolII antibodies. (F) ssDNA-Seq analyses of relaxed (upper) or supercoiled (lower) pFLIP plasmids containing human Myc FUSE element. ssDNA-Seq 5’ and 3’ tags are represented in blue and red respectively.
Figure 4
Figure 4. ssDNA-Seq profiles in primary B cells
(A) Distribution of ssDNA signals in primary LPS+IL4 activated B cells. (B) Correlation between mRNA transcripts, PolII recruitment, and ssDNA at Dpagt1, H2afx, and Hmbs genes. Data represented as sequence tags per million (TPM). (C) Bimodal distribution of gene expression in activated B cells. Red and blue lines delineate first and second components respectively. Black dashed lines demarcate the threshold for highly expressed, low expressed, and silent genes. (D) Heat map of ssDNA-Seq profiles around TSSs (+/− 2Kb) for high, low, and silent gene groups defined in panel C. (E) ssDNA composite alignment at elongating (1 ≤ Pi ≤ 3, red line) and paused (Pi ≥ 10, black line) genes. (F) Density graph, p300+ islands associated with enhancers (H3K4me1highH2AZlow) or promoters (H3K4me1lowH2AZhigh). Data was normalized as fold enrichment. (G) Heat maps showing PolII and ssDNA at p300+ promoter (grey) or enhancers (red). (H) Alignment of PolII (black line, left y-axis) and ssDNA (red line, right y-axis) at p300+H3K4me1highH2AZlow enhancers.
Figure 5
Figure 5. Reduced promoter melting and TFIIH levels in G0
(A) PolII and ssDNA density determined at Sfi1 gene in resting and activated B cells. Data was normalized as sequence tags per million (TPM). (B) Heat map plots of ssDNA at Ensembl mouse genes (+/− 2Kb) from activated and resting B cells. (C) Left: TFIIH subunit protein levels measured in resting [R] and 48hs LPS+IL4 activated [A] B cells by Western blot. Right: PolII subunits and the general transcription machinery. (D) XPB helicase protein levels measured in XPBYFP/YFP B cells or XPB+/+ controls. Lymphocytes were activated with LPS+IL4 for 24h and YFP expression was monitored by flow cytometry. (E) Left: Western blot measurement of PolIIS5P during activation. Gel loading was normalized per total protein content. Right: box plots represent the ratio of PolII-S5P vs. total PolII in resting (blue) and activated (red) B cells as determined by ChIP-Seq analysis. Values were normalized as TPM per total PolII-S5P and PolII per cell. Data are represented as mean +/− SEM (n = 4). (F) In vitro transcription of a linear DNA template (pG5HM(C2AT) plasmid) carrying a minimal promoter. DNA was incubated with equal amounts (80ng) of nuclear cell extracts. Reactions were complemented (+) with affinity purified TFIIH. Bar graph compares transcription levels between TFIIH-complemented reactions (+) and those without (−). Transcription in non-complemented reactions was set up to 100%. Data are represented as mean +/− SEM (n = 6).
Figure 6
Figure 6. TFIIH expression correlates with extent of transcription and promoter melting in XPD patient fibroblasts
(A) XPD and Cdk7 protein levels in fibroblasts isolated from TTD patients carrying an XPD temperature sensitive mutant. TTD + XPD denotes fibroblasts reconstituted with wild type XPD. Cells were grown at 37°C or 41°C for at least 72 h. (B) mRNA levels in TTD fibroblasts grown at 37°C or 41°C. Data are represented as mean +/− SEM (n = 4). (C) Composite profiles of ssDNA in TTD or reconstituted fibroblasts grown at the two temperatures. (D) The findings indicate that resting lymphocytes hold tightly their transcriptome “on a leash” by allowing mostly normal recruitment and assembly of PolII, while limiting promoter melting. This scenario might be the result of low levels of TFIIH, Myc, and/or potentially additional mechanisms (upper schematics). Upon activation, extensive melting and a rapid shift from basal to full transcriptome expression correlates with stabilization of TFIIH and Myc protein levels (lower schematics). Pictures designed by Alan Hoofring from NIH Medical Arts.

Comment in

References

    1. Assfalg R, Lebedev A, Gonzalez OG, Schelling A, Koch S, Iben S. TFIIH is an elongation factor of RNA polymerase I. Nucleic Acids Res. 2012;40:650–659. - PMC - PubMed
    1. Barlow JH, Faryabi RB, Callen E, Wong N, Malhowski A, Chen HT, Gutierrez-Cruz G, Sun HW, McKinnon P, Wright GW, et al. Identification of Early Replicating Fragile Sites that Contribute to Genome Instability. Cell. 2013 - PMC - PubMed
    1. Benham CJ, Bi C. The analysis of stress-induced duplex destabilization in long genomic DNA sequences. J Comput Biol. 2004;11:519–543. - PubMed
    1. Bentley DL, Groudine M. A block to elongation is largely responsible for decreased transcription of c-myc in differentiated HL60 cells. Nature. 1986;321:702–706. - PubMed
    1. Bernstein BE, Mikkelsen TS, Xie X, Kamal M, Huebert DJ, Cuff J, Fry B, Meissner A, Wernig M, Plath K, et al. A bivalent chromatin structure marks key developmental genes in embryonic stem cells. Cell. 2006;125:315–326. - PubMed

Publication types

Substances

Associated data