. 2013 May 23;153(5):1025-35.
doi: 10.1016/j.cell.2013.04.040.

Rhythmic modulation of the hematopoietic niche through neutrophil clearance

Affiliations

Rhythmic modulation of the hematopoietic niche through neutrophil clearance

María Casanova-Acebes et al. Cell. .

Abstract

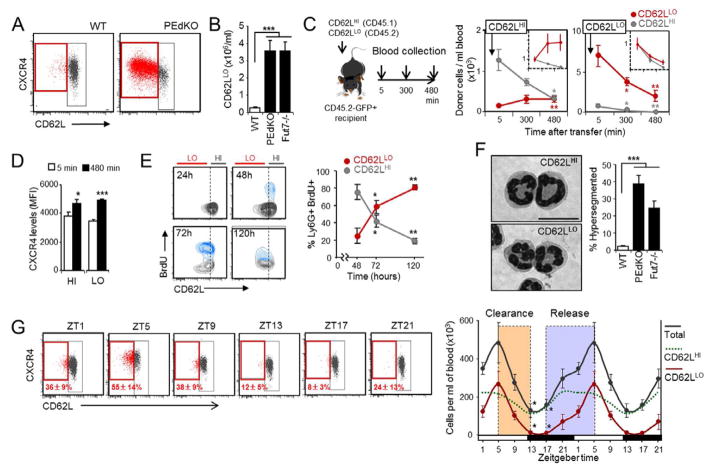
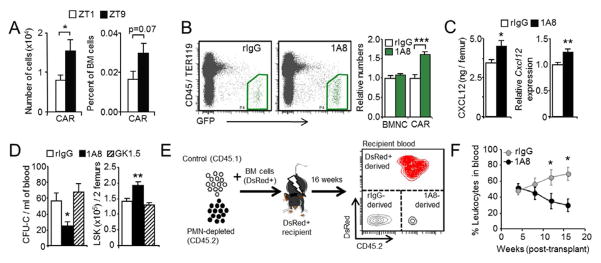
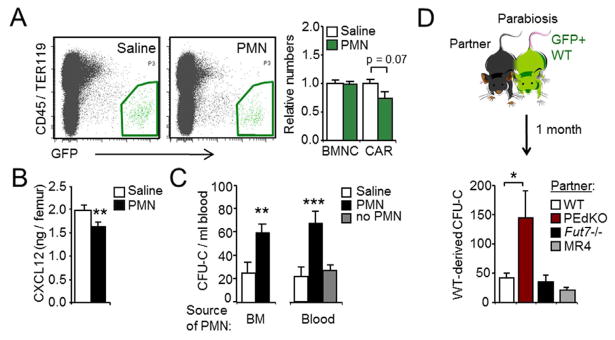
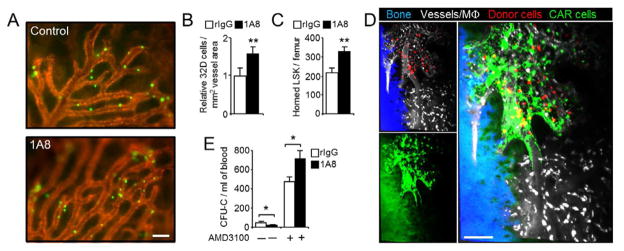
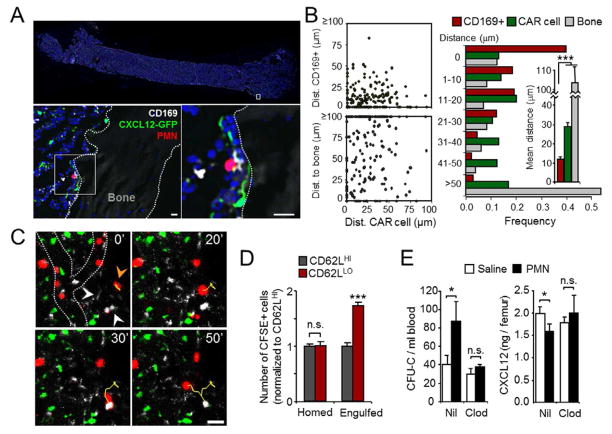
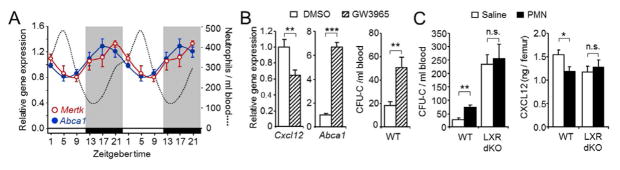
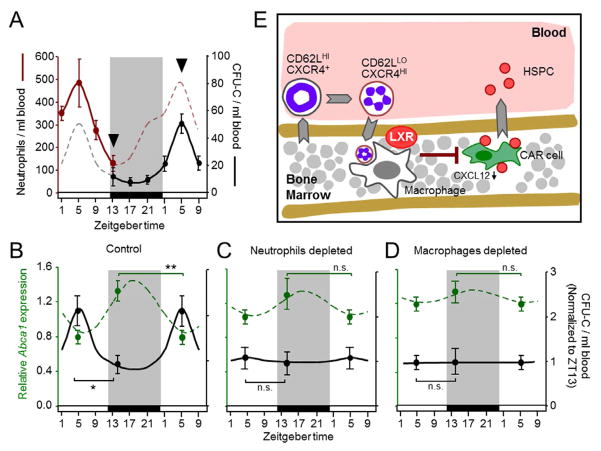
Unique among leukocytes, neutrophils follow daily cycles of release from and migration back into the bone marrow, where they are eliminated. Because removal of dying cells generates homeostatic signals, we explored whether neutrophil elimination triggers circadian events in the steady state. Here, we report that the homeostatic clearance of neutrophils provides cues that modulate the physiology of the bone marrow. We identify a population of CD62L(LO) CXCR4(HI) neutrophils that have "aged" in the circulation and are eliminated at the end of the resting period in mice. Aged neutrophils infiltrate the bone marrow and promote reductions in the size and function of the hematopoietic niche. Modulation of the niche depends on macrophages and activation of cholesterol-sensing nuclear receptors and is essential for the rhythmic egress of hematopoietic progenitors into the circulation. Our results unveil a process that synchronizes immune and hematopoietic rhythms and expand the ascribed functions of neutrophils beyond inflammation. PAPERFLICK:


Conflict of interest statement

The authors declare no conflicts of interest.

Figures

Figure 1
Figure 1. Phenotype and kinetics of aged neutrophils in blood
(A) Flow cytometric analysis of CD62L and CXCR4 expression in Ly6G+ blood neutrophils. n=5 mice. (B) Number of CD62LLO neutrophils in the blood of WT, PEdKO and Fut7−/− mice. n=8–18. (C) Scheme of transfer experiments of CD62LLO CD45.2+ and CD62LHI CD45.1+ neutrophils into GFP+ mice. Graphs show the absolute number of CD62LHI or CD62LLO neutrophils derived from donor cells at different times after transfer. Insets show the relative changes of each population. n=5 mice. Statistics are vs. t = 5 min. (D) Intensity of CXCR4 expression in CD62LHI and CD62LLO neutrophils 5 and 480 min after transfer. n=5 mice. (E) Density plots and frequencies of CD62LHI and CD62LLO neutrophils among Ly6G+ BrdU+ cells at different times post-labeling. n=5 mice. Statistics are vs. 48h. See also Figure S1B. (F) Bright-field micrographs of sorted CD62LHI and CD62LLO blood neutrophils (scale bar, 10 μm), and frequency of hypersegmented neutrophils in blood. n=3–4 mice. (G) Cytometry plots showing CD62L and CXCR4 expression in blood neutrophils at different times of the day. Indicated also are the mean percentage ± s.e.m. of CD62LLO cells out of total neutrophils at each time. The right graph shows the number of total, CD62LHI and CD62LLO neutrophils at the same times. Colored boxes highlight periods of clearance and release. n=5–9 mice. Statistics are vs. ZT5. Data are shown as mean ± s.e.m. *P<0.05, **P<0.01, ***P<0.001. See also Figure S1.
Figure 2
Figure 2. Circadian changes of the hematopoietic niche and modulation by neutrophil depletion
(A) Number and percentage of CAR cells in the BM of Cxcl12-Gfp mice at ZT1 and ZT9. n=8 mice per group. (B) Representative plots and relative number of total nucleated cells (BMNC) and CAR cells (green regions) in the BM of Cxcl12-Gfp mice depleted (1A8) or not (rIgG) of neutrophils. BM samples were analyzed at ZT5. n=9 mice. (C) CXCL12 protein and transcript levels in the BM of the groups shown in (A). n=7–9 mice. (D) CFU-Cs in blood and number of LSK progenitors in femurs of mice treated with antibodies to deplete neutrophils (1A8), T cells (GK1.5) or control rIgG. Blood samples were analyzed at ZT5. n=5–16 mice. (E) Strategy for the competitive long-term reconstitution assays. (F) Percentage of blood leukocytes derived from long-term repopulating HSC present in the blood of control (rIgG) or neutrophil-depleted (1A8) donor mice in transplanted mice over sixteen weeks. Data from a representative experiment with 5 mice. Data are shown as mean ± s.e.m. *P<0.05, **P<0.01. See also Figure S2.
Figure 3
Figure 3. Modulation of the hematopoietic niche by neutrophil transfer
(A) Representative plots and relative number of BMNC and CAR cells (green regions) in the BM of Cxcl12-Gfp mice injected with saline or with neutrophils. BM samples were analyzed at ZT1. n=7–10 mice. (B) CXCL12 protein levels in WT mice treated as in (A). n=10–14 mice. (C) CFU-Cs in the blood of mice treated with BM- or blood-derived neutrophils, or blood leukocytes depleted of neutrophils (no PMN). Blood samples were analyzed at ZT1. Note that the baseline levels of CFU-C in blood differ with the neutrophil-depletion experiments (Figure 2D) because samples were collected at different times of the day, ZT5 and ZT1, respectively. n=6–14 mice. (D) Scheme of parabiosis experiments, and number of blood CFU-C derived from GFP+ WT mice after one month. n=5–12 pairs. Data are shown as mean ± s.e.m. *P<0.05, **P<0.01, ***P<0.001. See also Figure S3.
Figure 4
Figure 4. Neutrophils modulate the capacity of the hematopoietic niche to attract and retain immature leukocytes
(A) Representative micrographs showing homed 32D cells (green) and BM microvessels (red) in control and 1A8-treated mice. Scale bar, 100 μm. (B) Quantification of homed cells per vessel area in the BM of control (rIgG) or neutrophil-depleted (1A8) mice. Values were obtained from the experiments illustrated in (A). n =4–5 mice. (C) Relative number of donor-derived DsRed+ LSK cells that home into the BM of control (rIgG) or neutrophil-depleted (1A8) mice, as determined by flow cytometry. n=5–6 mice. (D) DsRed+ BM-derived donor cells (red) home exclusively into areas of the BM enriched in CXCL12-producing cells (green; background green on the left corresponds to autofluorescent bone). Vessels and macrophages (white) are visualized with fluorescent dextran, and bone (blue) was imaged by second harmonic generation (See also Movie S1). Small panels on the left are shown merged on the right panel. The micrograph is representative of four Cxcl12-Gfp mice imaged by multiphoton microscopy. Scale bar, 100 μm. (E) Mobilization of control (rIgG) or neutrophil-depleted mice (1A8) with AMD3100. n=5–6 mice. Data are shown as mean ± s.e.m. *P<0.05, **P<0.01.
Figure 5
Figure 5. Intramedullary interactions between macrophages and cleared neutrophils are required for niche modulation
(A) Whole femoral sections from Cxcl12-Gfp mice injected with DsRed+ aged neutrophils. Scale bars, 10 μm. (B) Plots showing distances between each homed neutrophil and bone surfaces, CD169+ macrophages or CAR cells, which are quantified in the horizontal bars. Data from 198 homed neutrophils from 3 experiments. (C) Time-lapse imaging of DsRed+ aged neutrophils (red) in the BM of Cxcl12-Gfp mice, obtained by combined in vivo multiphoton and confocal microscopy (see also Movie S2). Yellow lines depict the trajectory over 50 minutes of one neutrophil (orange arrowhead at t=0) that sequentially moves towards two macrophages (white arrowheads at t=0) but not towards CAR cells (green). Dotted lines in the top left panel show the outline of blood vessels within this region. Scale bar, 10 μm. (D) Competitive homing and engulfment of CFSE-labeled CD62LHI vs. CD62LLO neutrophils within the BM (see also Figure S4B). n=5 mice. (E) Blood CFU-C and CXCL12 protein levels in the BM of control (Nil) or macrophage-depleted (Clod) mice, after treatment with saline or 106 neutrophils (see also Figure S4D). n=5 mice. Data are shown as mean ± s.e.m. *P<0.05, **P<0.01, ***P<0.001. See also Figure S4.
Figure 6
Figure 6. Requirement of LXR receptors during niche modulation
(A) Relative levels of Mertk and Abca1 gene expression at different Zeitgeber times of the day. For reference, the dotted line shows the levels of blood neutrophils. Shaded areas represent periods of darkness. n=4–9 mice per time. (B) Levels of Cxcl12 and Abca1 transcripts in BM and number of blood CFU-C after treatment with the LXR agonist GW3965, or with vehicle control (DMSO). n=5 mice. (C) Number of blood CFU-C and CXCL12 protein levels in the BM of WT or LXR-deficient mice (LXR dKO) after treatment with saline or 106 neutrophils. Samples were analyzed at ZT1. n=7–9 mice. Data are shown as mean ± s.e.m. *P<0.05, **P<0.01, ***P<0.001. See also Figure S5.
Figure 7
Figure 7. Circadian changes in the hematopoietic niche and progenitor trafficking are triggered by neutrophil clearance
(A) Circadian oscillations in the number of neutrophils and CFU-C in the blood of WT mice. Arrowheads highlight the times of highest and lowest levels used for further analyses. Shaded areas represent periods of darkness. (B–D) Daily fluctuations in the levels of hematopoietic progenitors in blood (black) and Abca1 transcripts in BM (dashed green) at ZT5 and ZT13 in control mice (B), or in mice in which neutrophils (C) or macrophages (D) were depleted. The lines represent the circadian variations of both parameters over a 29h period. Note that the point at ZT5 is repeated for clarity. n=8–14 mice for CFU-C; n=5 for Abca1 transcripts. (E) Scheme summarizing the sequence of events identified in this study. CD62LHI neutrophils are released into blood and age to become CD62LLO CXCR4HI. At specific times of the day, CD62LLO neutrophils migrate back to the BM where they are phagocytosed by macrophages. Activation of LXR receptors is additionally required to induce reductions in the capacity of the hematopoietic niche to retain HPC, which are released into the bloodstream. All events indicated by arrows occur with circadian periodicity. Data are shown as mean ± s.e.m. *P<0.05, **P<0.01, ***P<0.001.

Comment in

References

    1. Gonzalez AN, Bensinger SJ, Hong C, Beceiro S, Bradley MN, Zelcer N, Deniz J, Ramirez C, Diaz M, Gallardo G, et al. Apoptotic cells promote their own clearance and immune tolerance through activation of the nuclear receptor LXR. Immunity. 2009;31:245–258. - PMC - PubMed
    1. Adams GB, Martin RP, Alley IR, Chabner KT, Cohen KS, Calvi LM, Kronenberg HM, Scadden DT. Therapeutic targeting of a stem cell niche. Nat Biotechnol. 2007;25:238–243. - PubMed
    1. Basu S, Hodgson G, Katz M, Dunn AR. Evaluation of role of G-CSF in the production, survival, and release of neutrophils from bone marrow into circulation. Blood. 2002;100:854–861. - PubMed
    1. Broxmeyer HE, Orschell CM, Clapp DW, Hangoc G, Cooper S, Plett PA, Liles WC, Li X, Graham-Evans B, Campbell TB, et al. Rapid mobilization of murine and human hematopoietic stem and progenitor cells with AMD3100, a CXCR4 antagonist. J Exp Med. 2005;201:1307–1318. - PMC - PubMed
    1. Calkin AC, Tontonoz P. Transcriptional integration of metabolism by the nuclear sterol-activated receptors LXR and FXR. Nat Rev Mol Cell Biol. 2012;13:213–224. - PMC - PubMed

Publication types