. 2013 May 23;153(5):1064-79.
doi: 10.1016/j.cell.2013.04.055.

The eEF2 kinase confers resistance to nutrient deprivation by blocking translation elongation

Affiliations

The eEF2 kinase confers resistance to nutrient deprivation by blocking translation elongation

Gabriel Leprivier et al. Cell. .

Abstract

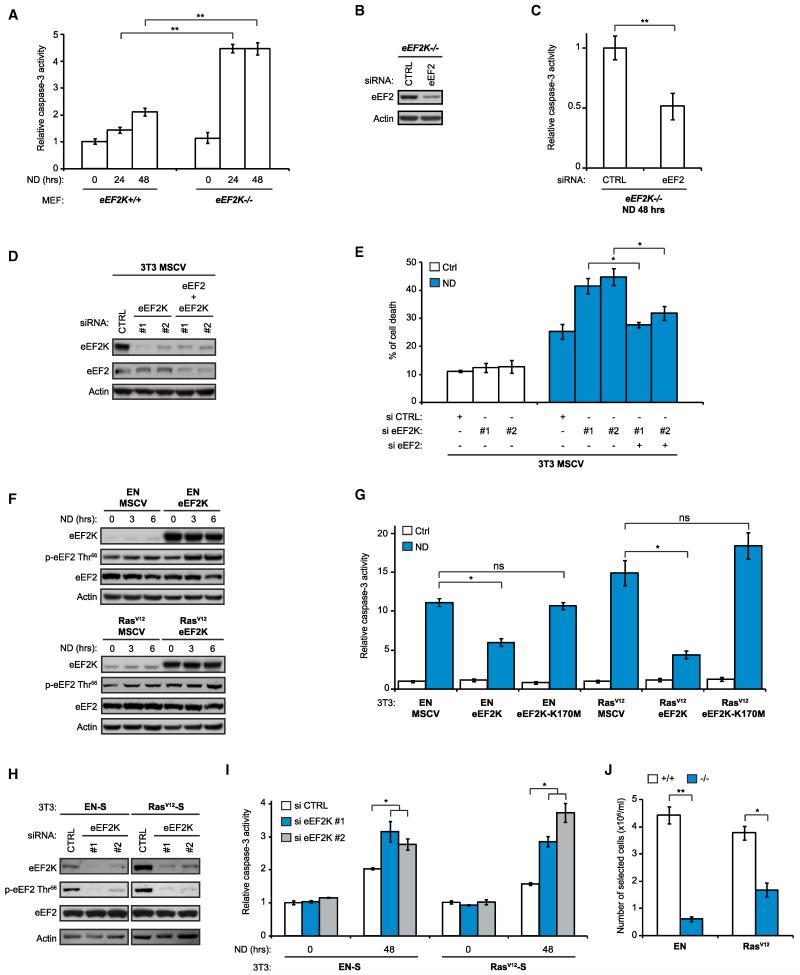
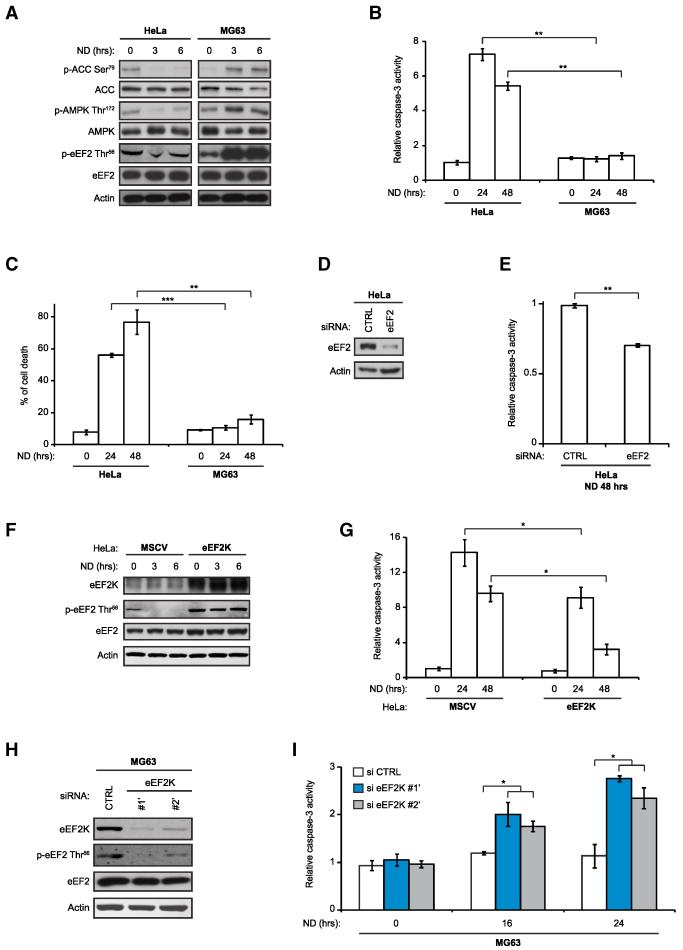
Metabolic adaptation is essential for cell survival during nutrient deprivation. We report that eukaryotic elongation factor 2 kinase (eEF2K), which is activated by AMP-kinase (AMPK), confers cell survival under acute nutrient depletion by blocking translation elongation. Tumor cells exploit this pathway to adapt to nutrient deprivation by reactivating the AMPK-eEF2K axis. Adaptation of transformed cells to nutrient withdrawal is severely compromised in cells lacking eEF2K. Moreover, eEF2K knockdown restored sensitivity to acute nutrient deprivation in highly resistant human tumor cell lines. In vivo, overexpression of eEF2K rendered murine tumors remarkably resistant to caloric restriction. Expression of eEF2K strongly correlated with overall survival in human medulloblastoma and glioblastoma multiforme. Finally, C. elegans strains deficient in efk-1, the eEF2K ortholog, were severely compromised in their response to nutrient depletion. Our data highlight a conserved role for eEF2K in protecting cells from nutrient deprivation and in conferring tumor cell adaptation to metabolic stress. PAPERCLIP:


Figures

Figure 1
Figure 1. Oncogenic Transformation Sensitizes Cells to ND and Alters eEF2 Signaling Pathways
(A) Caspase-3 activity assays for NIH 3T3 MSCV, EN, and RasV12 cells grown in complete media or deprived of nutrients (ND) for the indicated times (n = 3). (B) Schematic representation of nutrient-responsive signaling pathways assessed in this study. Gray arrows and bars indicate release from regulatory effects of upstream pathways. (C) Immunoblot analysis of NIH 3T3 MSCV, EN, and RasV12 cells grown in complete media or under ND for the indicated times. (D) Intracellular levels of AMP and ATP in NIH 3T3 MSCV, EN, RasV12, EN-S, and RasV12-S cells grown in complete media (Ctrl) or under ND for 6 hr. Results are expressed as relative fold increases of AMP:ATP ratio over MSCV Ctrl for n = 3. (E) Immunoblot analysis of NIH 3T3 EN and RasV12 cells deprived of nutrients (1 hr) and treated with Akt inhibitor VII (Akti; 1 μM), rotenone (0.5 μM), 2-deoxyglucose (2-DG; 25 mM), or vehicle. (F) Scheme for generation of EN-S and RasV12-S cells from NIH 3T3 EN and RasV12 cells (top). Caspase-3 activity assays of NIH 3T3 EN, EN-S, RasV12, and RasV12-S cells grown in complete media or under ND as indicated (n = 3) (bottom). (G) Immunoblot analysis of NIH 3T3 EN, EN-S, RasV12, and RasV12-S cells grown in complete media or under ND for the indicated times. (H) Immunoblot analysis of NIH 3T3 EN-S/MSCV, EN-S/DN-AMPK, RasV12-S/MSCV, and RasV12-S/DN-AMPK cells grown in complete media or under ND for the indicated times. (I) Caspase-3 assays of NIH 3T3 EN-S/MSCV, EN-S/DN-AMPK, RasV12-S/MSCV, and RasV12-S/DN-AMPK cells grown in complete media (Ctrl) or under ND for 48 hr (n = 3). Where shown, data are reported as means ± SD with indicated significance (*p < 0.05, **p < 0.01, and ***p < 0.005). See also Figures S1 and S2.
Figure 2
Figure 2. Translation Elongation Activity Is Sustained in Transformed Cells under ND and Reduces Their Survival
(A) Protein synthesis levels in NIH 3T3 MSCV, EN, and RasV12 cells deprived of nutrients for 5 min or 1, 3, or 6 hr determined by [35S]-methionine/cysteine(Met/Cys) incorporation. Results are expressed as a percentage of [35S]-Met/Cys incorporation/mg protein relative to MSCV cells at 5 min (n = 2). (B) Polysome profiles for NIH 3T3 MSCV, EN, and RasV12 cells grown in complete media or under ND for 70 min as described in Extended Experimental Procedures. P/S indicates ratio of polysomal to subpolysomal (40S, 60S, and 80S) fractions. (C) Ribosome half-transit times for NIH 3T3 MSCV, EN, and RasV12 cells grown in complete media or under ND for 70 min. [35S]-Met/Cys incorporation into all polypeptides (postmitochondrial supernatant, PMS) and into polypeptides released from ribosomes (postribosomal supernatant, PRS) was obtained by linear regression analysis. Representative results from three different experiments are shown. (D and E) siRNA-mediated knockdown of eEF2 in NIH 3T3 EN and RasV12 cells. Cells were transiently transfected with 12.5 nM of control (CTRL) or eEF2-directed siRNAs, grown in complete media for 48 hr, and placed under ND for 48 hr. Lysates were either analyzed by immunoblotting (D) or assayed for caspase-3 activity (n = 3) (E). (F and G) siRNA-mediated knockdown of eEF2 in NIH 3T3 EN-S/MSCV, EN-S/DN-AMPK, RasV12-S/MSCV, and RasV12-S/DN-AMPK cells. Cells were transfected, treated, and analyzed as in (D) and (E). Where shown, data are reported as means ± SD with indicated significance (**p < 0.005). See also Figure S3.
Figure 3
Figure 3. eEF2K Is Critical for the Adaptation of Fibroblasts to ND
(A) Caspase-3 activity assays for eEF2K+/+ and eEF2K−/− MEFs grown in complete media or under ND for the indicated times (n = 3). (B and C) siRNA-mediated knockdown of eEF2 in eEF2K−/− MEFs. Cells were transiently transfected with 12.5 nM of control (CTRL) or eEF2-directed siRNAs, grown in complete media for 48 hr, and placed under ND for 48 hr. Cell lysates were either analyzed by immunoblotting (B) or assayed for caspase-3 activity (n = 3) (C). (D and E) siRNA-mediated knockdown of eEF2K and eEF2 in NIH 3T3 MSCV cells by transient transfection with 37.5 nM of control (siCTRL) or 25 nM of eEF2K siRNAs (si eEF2K#1 and eEF2K#2) combined with 12.5 nM of control or eEF2 siRNAs. Cells were treated as described in (B) and (C). Lysates were analyzed by immunoblotting (D) or assayed for cell death (n = 3) (E). (F) Immunoblot analysis of NIH 3T3 EN/MSCV, EN/eEF2K, RasV12/MSCV, and RasV12/eEF2K grown in complete media or under ND for the indicated times. (G) Caspase-3 activity assays for NIH 3T3 EN/MSCV, EN/eEF2K, EN/eEF2K-K170M (kinase-dead), RasV12/MSCV, RasV12/eEF2K, and RasV12/eEF2K-K170M cells grown in complete media (Ctrl) or under ND for 48 hr (n = 3). (H and I) siRNA-mediated knockdown of eEF2K in NIH 3T3 EN-S and RasV12-S cells. Cells were transiently transfected with 25 nM of control (siCTRL) or eEF2K (si eEF2K#1 and eEF2K#2) siRNAs and grown in complete media for 72 hr. Cells were placed under ND either for 3 hr and analyzed by immunoblotting (H) or for 72 hr and assayed for caspase-3 activity (n = 3) (I). (J) Cell adaptation assays for eEF2K+/+ and eEF2K−/− MEFs expressing EN or RasV12. Cells were subjected to the adaptation protocol described in the Extended Experimental Procedures. Results are expressed as the number of cells alive at the completion of the experiment (n = 3). Where shown, data are reported as means ± SD with indicated significance (*p < 0.05 and **p < 0.01; ns, nonsignificant). See also Figure S4.
Figure 4
Figure 4. eEF2K Facilitates Survival of Human Tumor Cells in Response to ND
(A) Immunoblot analysis of HeLa and MG63 cells grown in complete media or under ND for the indicated times. (B and C) Caspase-3 activity assays (B) or cell death assays (C) for HeLa and MG63 cells grown in complete media or under ND for the indicated times (n = 3). (D and E) siRNA-mediated knockdown of eEF2 in HeLa cells. Cells were transiently transfected with 12.5 nM of control (CTRL) or eEF2-directed siRNAs, grown in complete media for 48 hr, and placed under ND for 48 hr. Cell lysates were either analyzed by immunoblotting (D) or assayed for caspase-3 activity (n = 3) (E). (F and G) Immunoblot analysis (F) or caspase-3 activity assays (n = 3) (G) of HeLa MSCV and HeLa eEF2K cells grown in complete media or under ND for the indicated times. (H and I) siRNA-mediated knockdown of eEF2K in MG63 cells. Cells were transiently transfected with 25 nM of control (siCTRL) or eEF2K (si eEF2K#1′ and eEF2K#2′) siRNAs and grown in complete media for 72 hr. Cells were placed under ND either for 3 hr and analyzed by immunoblotting (H) or for 72 hr and assayed for caspase-3 activity (n = 3) (I). Where shown, data are reported as means ± SD with indicated significance (*p < 0.05, **p < 0.01, and ***p < 0.005). See also Figure S5.
Figure 5
Figure 5. eEF2K Promotes Resistance of Tumors to Caloric Restriction-Induced Cell Death In Vivo
(A and B) Tumor volumes of NIH 3T3 RasV12/MSCV and RasV12/eEF2K (A) or EN/MSCV and EN/eEF2K (B) xenografts implanted subcutaneously in nu/nu mice. Mice were fed either AL or placed on CR diets (n = 10 mice/group). (C) Hematoxylin and eosin staining (H&E) of tumor xenografts from (A). Black arrows indicate regions of necrosis. Results are expressed as percentages of necrotic/total tumor areas (n = 3 mice per group). (D) Immunohistochemical (IHC) staining of tumor xenografts from (A) with antibodies against cleaved caspase-3. Graphs indicate percent of total cells that are positive for cleaved caspase-3 (n = 3 mice per group). (E) IHC staining of tumor xenografts from (A) with anti-phospho-eEF2 antibodies. (F) Immunoblot analysis of tumor lysates of tumor xenografts from (A). (G) Tumor volumes of eEF2K+/+ RasV12 and eEF2K−/− RasV12 xenografts implanted subcutaneously in nu/nu mice. Mice were fed either AL or placed on CR diets (n = 10 mice per group). (H) H&E staining of tumor xenografts from (G). Black arrows indicate areas of necrosis. Results are expressed as percentages of necrotic/total tumor areas (n = 3 mice per group). (I) IHC staining of tumor xenografts from (G) with antibodies to cleaved caspase-3. Graphs indicate the percent of total cells positive for cleaved caspase-3 (n = 3 mice per group). Where shown, data are reported as means ± SEM with indicated significance (*p < 0.05 and **p < 0.01; ns, nonsignificant). See also Figure S6.
Figure 6
Figure 6. eEF2K Transcript Levels Are Associated with Poor Prognosis in Medulloblastoma and Glioblastoma Multiforme
(A and B) Expression levels of eEF2K in the Toronto MB cohort (A) or in the European MB data set (B) (see Extended Experimental Procedures). FC and CB indicate fetal and adult cerebellum, respectively; MBs indicate the total cohort, and WNT, SHH, group 3, and group 4 indicate the specific disease subgroups. p values are shown below each panel and were generated using a Mann-Whitney U test. (C and D) Kaplan-Meier estimates of overall survival for MB patients from all subgroups (C) or from non-WNT/non-SHH subgroups (D) classified by eEF2K mRNA expression levels. The number of patients at risk is indicated for time increments of 24 months. p values were calculated using a log rank test. (E and F) Expression of eEF2K mRNA in normal human brain (NHB; n = 10) compared to GBM (n = 25) (E) or in specific disease subtypes of GBM (proneural, neural, classical, and mesenchymal) (F). p values were determined by ANOVA with a Bonferroni post hoc test. (G and H) Kaplan-Meier estimates of overall survival for all glioma patients (G) or GBM patients (H) classified by eEF2K mRNA expression levels. Survival is indicated for time increments of 2,000 (G) or 500 days (H). p values were calculated using a log rank test. (I and J) IHC staining for phospho-eEF2 in primary tumors (I, 1–2) and corresponding metastases (I, 3–4) from a mouse model of MB (Wu et al., 2012) or in human primary MB (J). Black arrows indicate the tumor regions, and white triangles indicate adjacent normal cerebellar tissue. (K) siRNA-mediated knockdown of eEF2K in d283 MB cells. Cells were transiently transfected with 25 nM of control (siCTRL) or eEF2K siRNAs (si eEF2K#1′ and eEF2K#2′), grown in complete media for 72 hr, and harvested or placed under ND for 24 hr. Cell lysates were assayed for caspase-3 activity. Error bars indicate SD for n = 3 (*p < 0.05). See also Figure S7.
Figure 7
Figure 7. The eEF2K Ortholog efk-1 Supports Survival of C. elegans under ND In Vivo
(A) Lifespans of C. elegans WT (N2) and efk-1 (ok3609) homozygous deletion mutants under ambient growth conditions. (B) Lifespans of N2 and efk-1 (ok3609) mutants at the L1 stage of development for the indicated days in the absence of food. Error bars indicate SEM for n = 142–150. (C) Quantitative RT-PCR for efk-1 mRNA levels in N2 worms held at the L1 stage for 24 hr in the absence of food (starved) or then placed on food (OP50 bacteria) for 3 hr (fed). Transcript levels were normalized to γ-tubulin (tbg-1) levels. Error bars indicate SD for n = 3 (*p < 0.05). (D) Quantitative RT-PCR for eEF2K transcripts in the indicated mammalian cell lines grown in complete media (Ctrl) or under ND for 24 hr. Transcript levels were normalized to β-actin (actb). Results are shown as relative levels in ND versus control conditions for each cell line. Error bars indicate SD for n = 2 (*p < 0.05). (E) Model for the proposed role of eEF2K/efk-1 in adaptation to ND in normal and tumor tissues. Gray arrows and bars indicate release from regulatory effects of upstream pathways.

Comment in

Similar articles

Cited by

References

    1. Baugh LR, Demodena J, Sternberg PW. RNA Pol II accumulates at promoters of growth genes during developmental arrest. Science. 2009;324:92–94. - PubMed
    1. Braunstein S, Karpisheva K, Pola C, Goldberg J, Hochman T, Yee H, Cangiarella J, Arju R, Formenti SC, Schneider RJ. A hypoxia-controlled cap-dependent to cap-independent translation switch in breast cancer. Mol. Cell. 2007;28:501–512. - PubMed
    1. Brenner S. The genetics of Caenorhabditis elegans. Genetics. 1974;77:71–94. - PMC - PubMed
    1. Buttgereit F, Brand MD. A hierarchy of ATP-consuming processes in mammalian cells. Biochem. J. 1995;312:163–167. - PMC - PubMed
    1. Buzzai M, Bauer DE, Jones RG, Deberardinis RJ, Hatzivassiliou G, Elstrom RL, Thompson CB. The glucose dependence of Akt-transformed cells can be reversed by pharmacologic activation of fatty acid beta-oxidation. Oncogene. 2005;24:4165–4173. - PubMed

Publication types

MeSH terms

Substances