

Spatial periodicity in growth plate shear mechanical properties is disrupted by vitamin D deficiency
- PMID: 23706979
- PMCID: PMC3782304
- DOI: 10.1016/j.jbiomech.2013.04.023
Spatial periodicity in growth plate shear mechanical properties is disrupted by vitamin D deficiency
Abstract
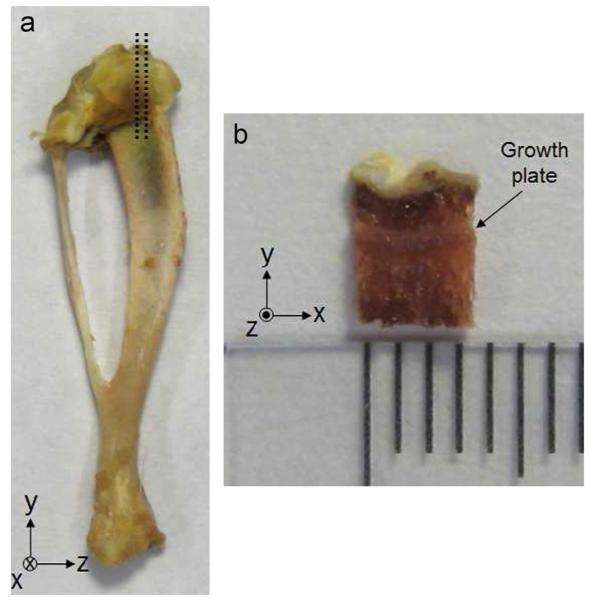
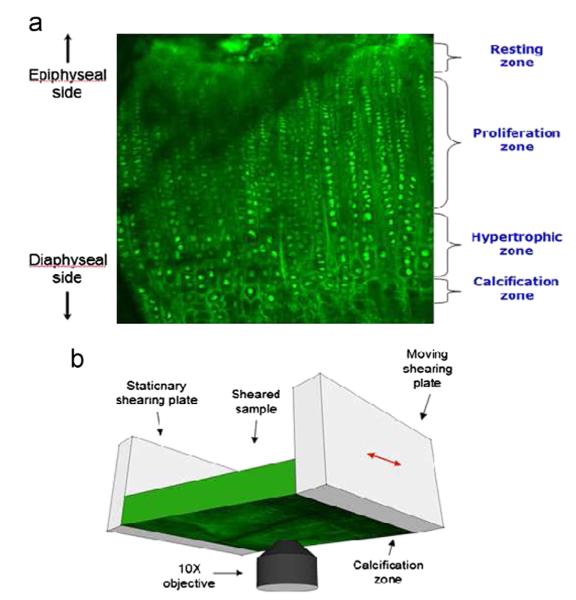
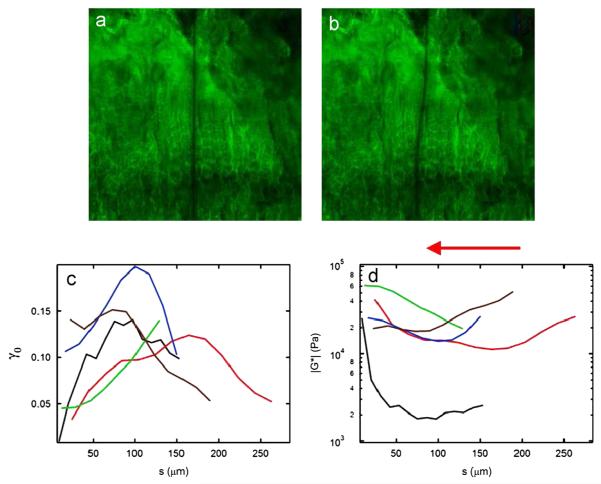
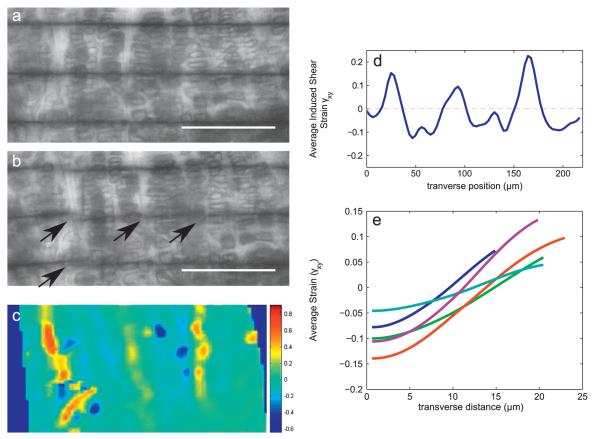
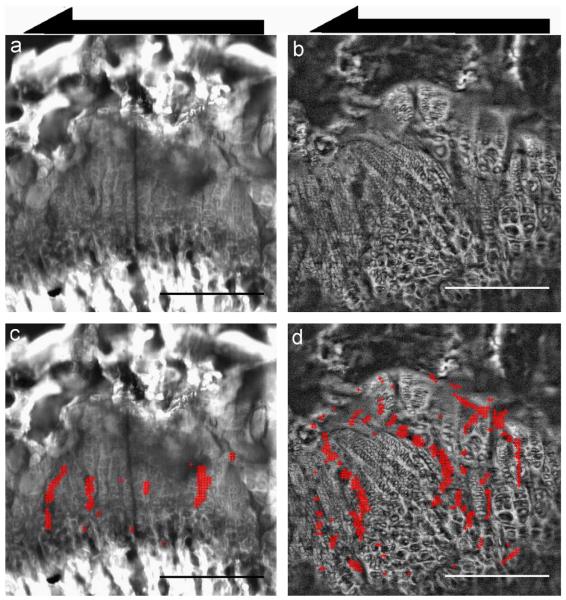
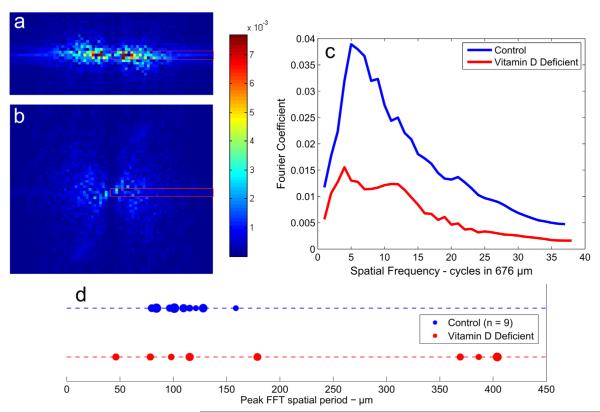
The growth plate is a highly organized section of cartilage in the long bones of growing children that is susceptible to mechanical failure as well as structural and functional disruption caused by a dietary deficiency of vitamin D. The shear mechanical properties of the proximal tibial growth plate of rats raised either on normal or vitamin D and calcium deficient diets were measured. A sinusoidal oscillating shear load was applied to small excised growth plate specimens perpendicular to the direction of growth while imaging the deformation in real time with a fast confocal microscope. Local deformations and shear strains were quantified using image correlation. The proliferative zone of the growth plate bores the majority of the shear strain and the resting, hypertrophic and calcification zones deformed less. Surprisingly, we regularly observed discontinuous deformations in the proliferative zone in both groups that resembled cell columns sliding past one another in the direction of growth. These discontinuities manifested as regions of concentrated longitudinal shear strain. Furthermore, these shear strain concentrations were spaced evenly in the proliferative zone and the spacing between them was similar across growth plate regions and across control specimens. In contrast to the healthy controls, the vitamin D deficient growth plate exhibited larger variations in the size and orientation of cellular columns in the proliferative and hypertrophic zones. High strains were observed between columns, much as they were in the controls. However, the regular spacing of shear strain concentrations was not preserved, echoing the observation of decreased structural organization.
Copyright © 2013 Elsevier Ltd. All rights reserved.
Figures
Similar articles
-
Stress relaxation of swine growth plate in semi-confined compression: depth dependent tissue deformational behavior versus extracellular matrix composition and collagen fiber organization.Biomech Model Mechanobiol. 2013 Jan;12(1):67-78. doi: 10.1007/s10237-012-0382-y. Epub 2012 Mar 25. Biomech Model Mechanobiol. 2013. PMID: 22446833
-
Non-uniform strain distribution within rat cartilaginous growth plate under uniaxial compression.J Biomech. 2007;40(1):149-56. doi: 10.1016/j.jbiomech.2005.11.008. Epub 2005 Dec 27. J Biomech. 2007. PMID: 16378613
-
Vitamin D deficiency and anatomical region alters porcine growth plate properties.J Biomech. 2022 Nov;144:111314. doi: 10.1016/j.jbiomech.2022.111314. Epub 2022 Sep 24. J Biomech. 2022. PMID: 36182792
-
Growth plate mechanics and mechanobiology. A survey of present understanding.J Biomech. 2009 Aug 25;42(12):1793-803. doi: 10.1016/j.jbiomech.2009.05.021. Epub 2009 Jun 21. J Biomech. 2009. PMID: 19540500 Free PMC article. Review.
-
Newest knowledge of the growth plate.Clin Orthop Relat Res. 1990 Apr;(253):270-8. Clin Orthop Relat Res. 1990. PMID: 2180603 Review.
Cited by
-
Osgood-Schlatter Disease: Appearance, Diagnosis and Treatment: A Narrative Review.Healthcare (Basel). 2022 May 30;10(6):1011. doi: 10.3390/healthcare10061011. Healthcare (Basel). 2022. PMID: 35742062 Free PMC article. Review.
-
The role of vitamin D in slipped capital femoral epiphysis in children and adolescents: a retrospective case-control study.Front Endocrinol (Lausanne). 2025 Jan 6;15:1497103. doi: 10.3389/fendo.2024.1497103. eCollection 2024. Front Endocrinol (Lausanne). 2025. PMID: 39835265 Free PMC article.
-
Understanding the Stiff-to-Compliant Transition of the Meniscal Attachments by Spatial Correlation of Composition, Structure, and Mechanics.ACS Appl Mater Interfaces. 2019 Jul 31;11(30):26559-26570. doi: 10.1021/acsami.9b03595. Epub 2019 Jul 18. ACS Appl Mater Interfaces. 2019. PMID: 31267742 Free PMC article.
-
Role of Physiotherapy in Osgood-Schlatter's Disease in Adolescent Volleyball Smasher: A Case Report.Cureus. 2024 Feb 4;16(2):e53534. doi: 10.7759/cureus.53534. eCollection 2024 Feb. Cureus. 2024. PMID: 38445126 Free PMC article.
-
Bulbous epiphysis and popcorn calcification as related to growth plate differentiation in osteogenesis imperfecta.Clin Cases Miner Bone Metab. 2015 May-Aug;12(2):202-6. doi: 10.11138/ccmbm/2015.12.2.202. Epub 2015 Oct 26. Clin Cases Miner Bone Metab. 2015. PMID: 26604951 Free PMC article.
References
-
- Akisaka T, Nakayama M, Yoshida H, Inoue M. Ultrastructural modifications of the extracellular matrix upon calcification of growth plate cartilage as revealed by quick-freeze deep etching technique. Calcified Tissue International. 1998;63:47–56. - PubMed
-
- Bonaventure J, Rousseau F, Legeai-Mallet L, Le Merrer M, Munnich A, Maroteaux P. Common mutations in the fibroblast growth factor receptor 3 (fgfr3) gene account for achondroplasia, hypochondroplasia, and thanatophoric dwarfism. American Journal of Medical Genetics. 1998;63:148–154. - PubMed
-
- Bonucci E, Motta P. Electron Microscopy in Biology and Medicine. Luwer Academic Publishers; 1990. Ultrastructure of Skeletal Tissues: Bone and Cartilage in Health and Disease.
-
- Bruehlmann S, Matyas J, Duncan N. Issls prize winner: collagen fibril sliding governs cell mechanics in the annulus fibrosus: an in situ confocal microscopy study of bovine discs. Spine. 2004;29:2612–2620. - PubMed
Publication types
MeSH terms
Substances
Grants and funding
LinkOut - more resources
Full Text Sources
Other Literature Sources
Medical
Miscellaneous
