

Association of dialysate bicarbonate concentration with mortality in the Dialysis Outcomes and Practice Patterns Study (DOPPS)
- PMID: 23707043
- PMCID: PMC3832240
- DOI: 10.1053/j.ajkd.2013.03.035
Association of dialysate bicarbonate concentration with mortality in the Dialysis Outcomes and Practice Patterns Study (DOPPS)
Abstract
Background: Most hemodialysis patients worldwide are treated with bicarbonate dialysis using sodium bicarbonate as the base. Few studies have assessed outcomes of patients treated with different dialysate bicarbonate levels, and the optimal concentration remains uncertain.
Study design: The Dialysis Outcomes and Practice Patterns Study (DOPPS) is an international prospective cohort study.
Setting & participants: This study included 17,031 patients receiving thrice-weekly in-center hemodialysis from 11 DOPPS countries (2002-2011).
Predictor: Dialysate bicarbonate concentration.
Outcomes: All-cause and cause-specific mortality and first hospitalization, using Cox regression to estimate the effects of dialysate bicarbonate concentration, adjusting for potential confounders.
Measurements: Demographics, comorbid conditions, laboratory values, and prescriptions were abstracted from medical records.
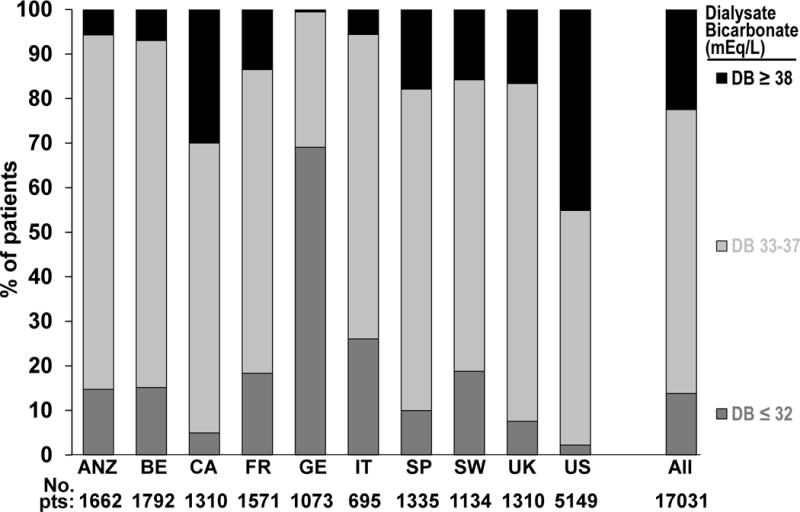
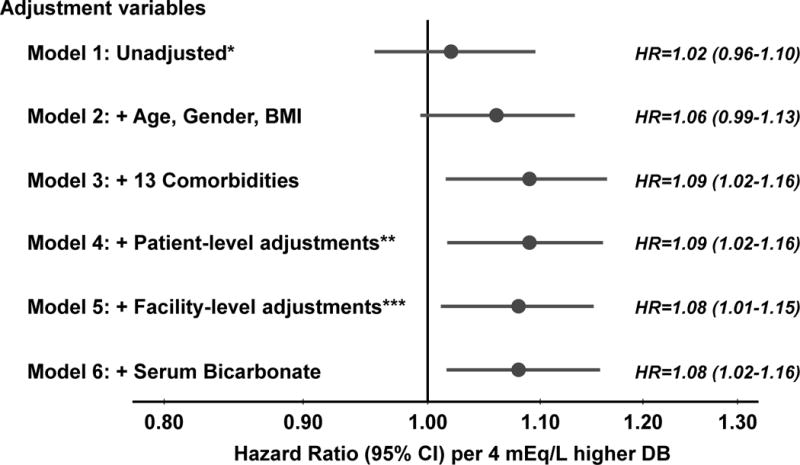
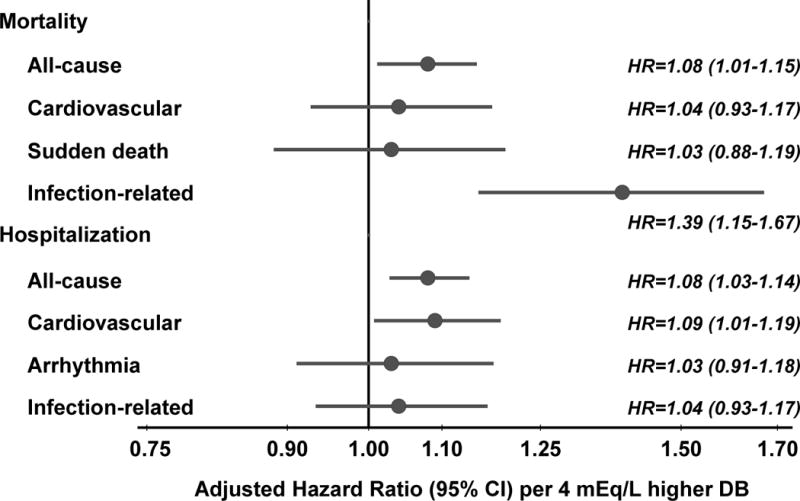
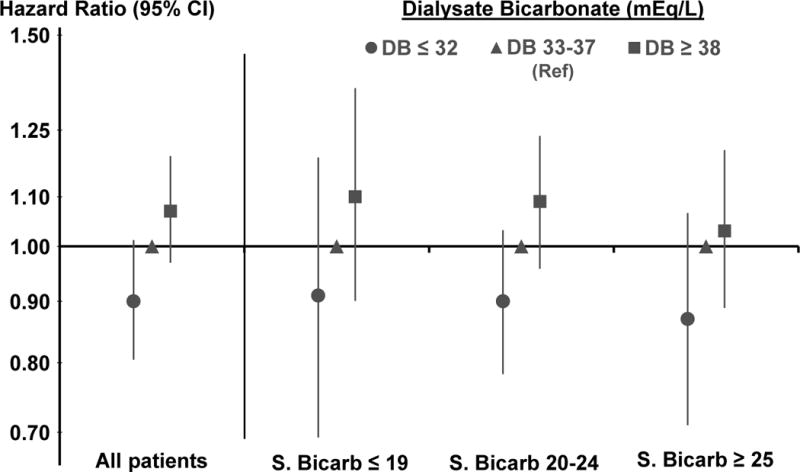
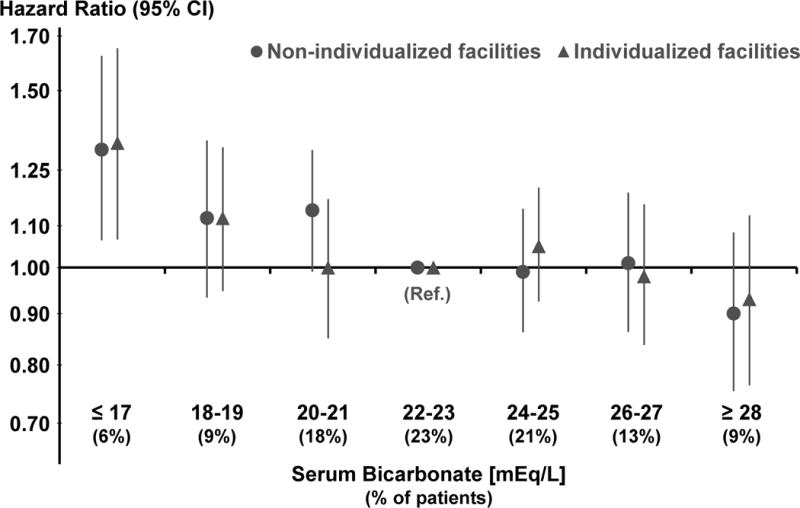
Results: Mean dialysate bicarbonate concentration was 35.5 ± 2.7 (SD) mEq/L, ranging from 32.2 ± 2.3 mEq/L in Germany to 37.0 ± 2.6 mEq/L in the United States. Prescription of high dialysate bicarbonate concentration (≥38 mEq/L) was most common in the United States (45% of patients). Approximately 50% of DOPPS facilities used a single dialysate bicarbonate concentration. 3,913 patients (23%) died during follow-up. Dialysate bicarbonate concentration was associated positively with mortality (adjusted HR, 1.08 per 4 mEq/L higher [95% CI, 1.01-1.15]; HR for dialysate bicarbonate ≥38 vs 33-37 mEq/L, 1.07 [95% CI, 0.97-1.19]). Results were consistent across levels of pre-dialysis session serum bicarbonate and between facilities that used a single dialysate bicarbonate concentration and those that prescribed different concentrations to individual patients. The association of dialysis bicarbonate concentration with mortality was stronger in patients with longer dialysis vintage.
Limitations: Due to the observational nature of the present study, we cannot rule out that the reported associations may be biased by unmeasured confounders.
Conclusions: High dialysate bicarbonate concentrations, especially prolonged exposure, may contribute to adverse outcomes, likely through the development of postdialysis metabolic alkalosis. Additional studies are warranted to identify the optimal dialysate bicarbonate concentration.
Keywords: Dialysis Outcomes and Practice Patterns Study (DOPPS); Hemodialysis; observational; outcomes; statistics.
Copyright © 2013 National Kidney Foundation, Inc. Published by Elsevier Inc. All rights reserved.
Figures
Comment in
-
Dialysis: A step towards optimal dialysate bicarbonate concentration.Nat Rev Nephrol. 2013 Oct;9(10):565-6. doi: 10.1038/nrneph.2013.167. Epub 2013 Aug 13. Nat Rev Nephrol. 2013. PMID: 23938597 No abstract available.
-
Dialysate bicarbonate: the case for foot-dragging.Am J Kidney Dis. 2013 Oct;62(4):650-2. doi: 10.1053/j.ajkd.2013.07.003. Am J Kidney Dis. 2013. PMID: 24054939 No abstract available.
References
-
- Franch HA, Mith WE. Catabolism in uremia: the impact of metabolic acidosis. J Am Soc Nephrol. 1998 Dec;9(12 Suppl):S78–81. - PubMed
-
- Uribarri J, Levin NW, Delmez J, et al. Association of acidosis and nutritional parameters in hemodialysis patients. Am J Kidney Dis. 1999 Sep;34(3):493–9. - PubMed
-
- National Kidney Foundation; K/DOQI Workgroup. K/DOQI Clinical Practice Guidelines for Nutrition in Chronic Renal Failure. Am J Kidney Dis. 2000;35(6):s17–s104. Supplement. - PubMed
-
- Eknoyan G, Levin A, Levin NW. Bone metabolism and disease in chronic kidney disease/KDOQI guidelines. Am J Kidney Dis. 2003;42(Supplement 3):1–201. - PubMed
-
- Locatelli F, Covic A, Chazot C, Leunissen K, Luño J, Yaqoob Optimal composition of the dialysate, with emphasis on its influence on blood pressure. Nephrol Dial Transplant. 2004 Apr;19(4):785–96. - PubMed
Publication types
MeSH terms
Substances
Grants and funding
LinkOut - more resources
Full Text Sources
Other Literature Sources
Medical
