. 2013 May 30;3(5):1567-79.
doi: 10.1016/j.celrep.2013.04.021. Epub 2013 May 23.

An aberrant transcription factor network essential for Wnt signaling and stem cell maintenance in glioblastoma

Affiliations

An aberrant transcription factor network essential for Wnt signaling and stem cell maintenance in glioblastoma

Esther Rheinbay et al. Cell Rep. .

Abstract

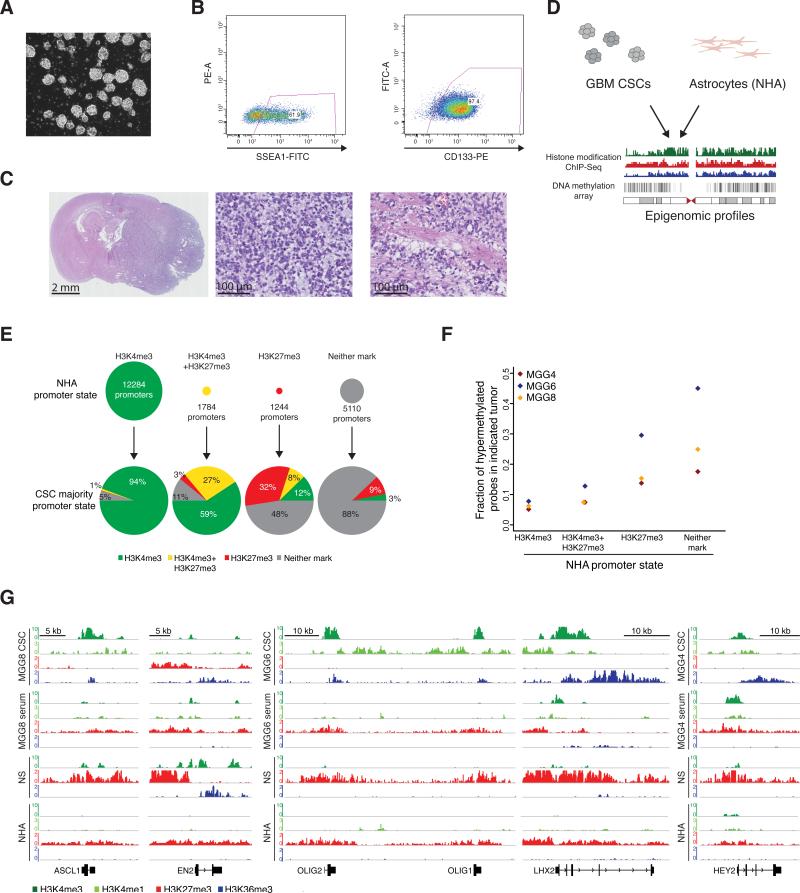
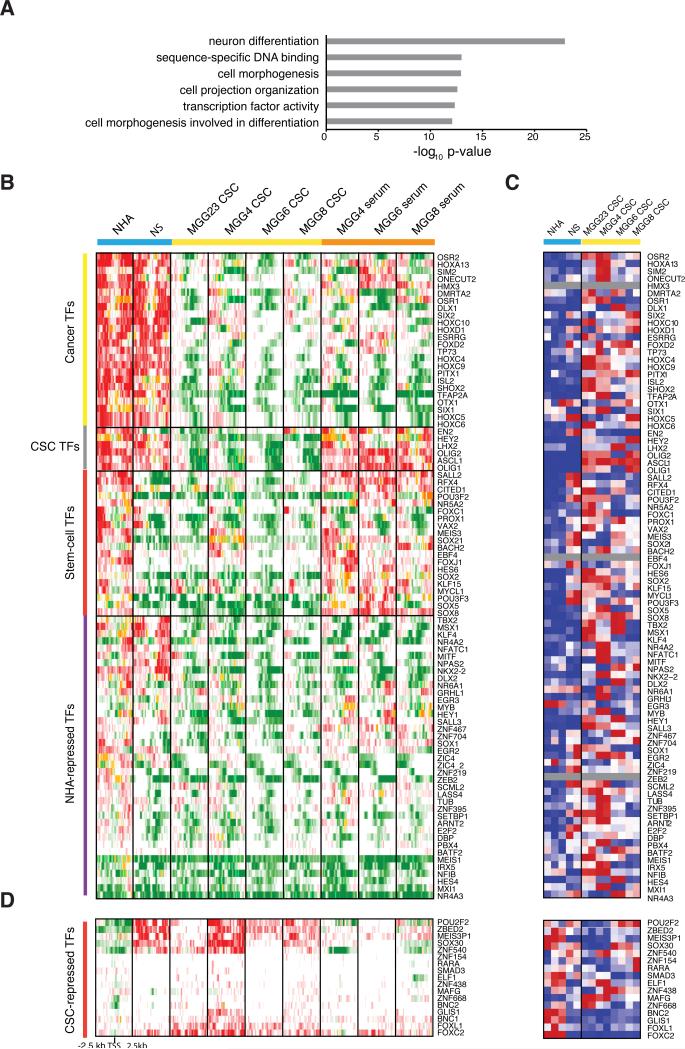
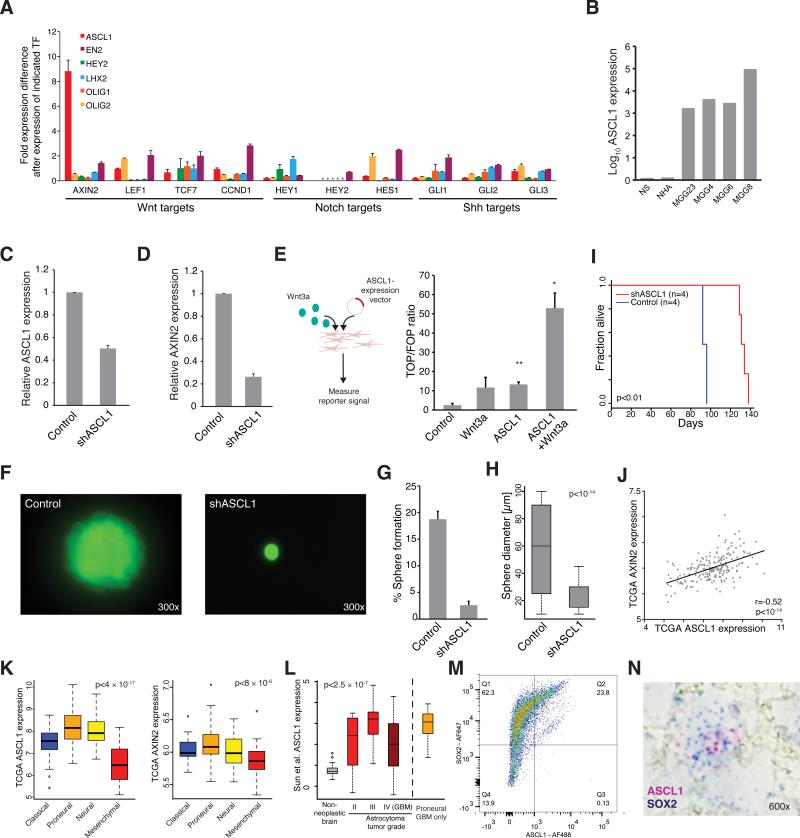
Glioblastoma (GBM) is thought to be driven by a subpopulation of cancer stem cells (CSCs) that self-renew and recapitulate tumor heterogeneity yet remain poorly understood. Here, we present a comparative analysis of chromatin state in GBM CSCs that reveals widespread activation of genes normally held in check by Polycomb repressors. These activated targets include a large set of developmental transcription factors (TFs) whose coordinated activation is unique to the CSCs. We demonstrate that a critical factor in the set, ASCL1, activates Wnt signaling by repressing the negative regulator DKK1. We show that ASCL1 is essential for the maintenance and in vivo tumorigenicity of GBM CSCs. Genome-wide binding profiles for ASCL1 and the Wnt effector LEF-1 provide mechanistic insight and suggest widespread interactions between the TF module and the signaling pathway. Our findings demonstrate regulatory connections among ASCL1, Wnt signaling, and collaborating TFs that are essential for the maintenance and tumorigenicity of GBM CSCs.


Figures

Figure 1
Figure 1. Characterization of the GBM CSC chromatin landscape
(A) GBM CSCs used for this study grow as gliomaspheres in serum-free neurobasal media. (B) FACS analysis of MGG8 GBM CSCs shows positivity for the GBM stem cell markers SSEA-1 and CD133. (C) Mouse brain cross-section after orthotopic xenotransplantation of MGG8 GBM CSCs (left). Higher magnification of tumor tissue depicts cytonuclear pleomorphism, mitotic and apoptotic figures (center) and infiltration along white matter tracks (right). (D) Schematic overview of study strategy. (E) Breakdown of TSS chromatin state in NHA (H3K4me3 only, H3K4me3+H3K27me3, H3K27me3 only, neither mark) and their consensus chromatin state in the GBM CSCs (see Experimental Procedures). A large fraction (59%) of genes bivalent in NHA becomes activated (H3K4me3 only, green) in GBM CSCs. (F) Fraction of DNA hyper-methylated (β≥0.75) probes in MGG4, MGG6, and MGG8 GBM CSCs contingent on NHA chromatin state of the probe. Probes marked with H3K27me3 only are twice as likely to become DNA methylated than those marked with both H3K4me3 and H3K27me3. (G) Chromatin state of six CSC-TFs in one representative GBM CSC line, matched serum-grown GBM cell line, NS and NHA. All TFs are active (H3K4me3 at promoter, H3K36me3 over the transcript) in GBM CSCs, but not NHA or serum-grown GBM cells as indicated by large domains of H3K27me3.
Figure 2
Figure 2. Aberrant activation and repression of TF Polycomb targets in GBM CSCs
(A) Representative top scoring functional terms enriched in genes active (H3K4me3 only) in GBM CSCs but repressed in NHA (see also Table S3). Scores are calculated based on Benjamini-Hochberg corrected p-values (see Experimental procedures). (B) H3K4me3 (green) and H3K27me3 signal (red) at aberrantly activated TF loci (−2.5kb to +2.5 kb from TSS) for indicated cell types. Orange indicates overlap of H3K4me3 and H3K27me3 signal (“bivalent”). Genes were clustered based on H3K27me3 signal. (C) Microarray gene expression data for activated TFs confirms chromatin state data (GSE46016). Red indicates high, blue low expression normalized by row. The expression changes are consistent with the chromatin changes, although the magnitude of expression change across samples is more variable. (D) Chromatin state and gene expression data for NHA-active, GBM CSC repressed TF loci. Color scheme as in (B) and (C).
Figure 3
Figure 3. ASCL1 is an upstream regulator of the Wnt pathway
(A) Relative expression of Wnt, Notch and Shh targets after ectopic lentiviral expression of indicated TF in NHA measured by RT-qPCR. * indicates not detectable. (B) mRNA levels of ASCL1 in NS, NHA and GBM CSCs measured on Affymetrix microarray (GSE46016). (C) Relative levels of ASCL1 after shRNA-mediated knock-down MGG4 CSCs by RT-qPCR. (D) Repression of AXIN2 upon knockdown of ASCL1 in MGG4 CSCs (t-test p<0.005). (E) Schematic of Wnt activation experiment and relative luciferase expression for a TCF/LEF-responsive promoter (TOPFLASH-Firefly) relative to a scrambled response element (FOPFLASH-Renilla) in 293T cells after lentiviral transfection with ASCL1 and addition of Wnt3a. ** indicates one-tailed t-test p<0.01, * indicates p<0.05. Individual examples (F) and quantification (G) of MGG4 CSC sphere-forming capacity in control and ASCL1-depleted cells. (H) Quantification of sphere diameter in control and ASCL1-depleted cells. (I) Kaplan-Meier survival curve for mice injected with 5,000 control (blue line) or ASCL1-depleted MGG4 CSCs (log-rank p-value <0.01). (J) Scatter plot shows correlation between AXIN2 and ASCL1 expression across 200 primary GBM samples (Verhaak et al., 2010). Each point denotes a single tumor sample. (K) TCGA ASCL1 (left) and AXIN2 (right) expression (Verhaak et al., 2010) correlate across molecular subtypes. Distributions for subtypes are significantly different from each other (Kruskal-Wallis p<4 × 10⁻¹⁷(ASCL1) and p<8 × 10⁻⁶ (AXIN2)). (L) ASCL1 expression (Sun et al., 2006) is increased in GBM, most strongly in the proneural subtype, and lower grade astrocytomas, relative to non-neoplastic brain, suggesting that ASCL1 induction may be an early event in gliomagenesis. (M) Intracellular staining and flow cytometric detection of the nuclear stem cell marker SOX2 and ASCL1 in primary GBM. The population of ASCL1+ cells (23.8%) is entirely contained within the SOX2+ compartment. Notably, the ASCL1+ subpopulation also displays highest levels of SOX2 expression. (N) RNA-ISH for SOX2 (blue dots) and ASCL1 (red dots) in primary GBM shows expression of ASCL1 in a restricted subset of SOX2+ cells. Error bars in RT-qPCR experiments indicate standard error of the mean.
Figure 4
Figure 4. ASCL1 regulates Wnt signaling through DKK1
(A) ChIP-Seq of ASCL1 in MGG8 CSCs (pink track) reveals enrichment at H3K4me1-marked distal elements in several Wnt pathway gene loci (grey shading). (B) Relative mRNA level change for ASCL1-bound Wnt pathway genes in NHA after ectopic expression of ASCL1. (C) ChIP-Seq maps depict the chromatin environment of the DKK1 gene locus and the ASCL1-bound enhancer (grey shading) in MGG8 CSCs and NHA. In the absence of ASCL1, the element is activated (as indicated by H3K27 acetylation in NHA) and DKK1 is expressed (increase in active marks H3K4me3, H3K4me1, H3K27ac and H3K36me3). (D) Expression levels of DKK1 in NS, NHA and GBM CSCs measured by microarray. (E) Expression changes of a TCF/LEF-responsive reporter (TOPFLASH-Firefly) relative to scrambled response elements (FOPFLASH-Renilla) in 293T cells after stimulation with the indicated combinations of Wnt3a protein and lentivirally-transfected ASCL1 and DKK1. DKK1 overexpression abrogates ASCL1-mediated Wnt induction. (F) DKK1 and ASCL1 expression patterns are inversely correlated in 200 GBM samples (Verhaak et al., 2010). Each point denotes a tumor sample. Error bars in RT-qPCR experiments indicate standard error of the mean.
Figure 5
Figure 5. Cross-talk of the TF module and Wnt signaling in GBM CSCs
(A) ChIP-Seq of LEF1 (purple track) in MGG8 CSCs reveals enrichment at H3K4me1-marked distal elements near several TF loci. (B) Relative mRNA level changes for Wnt-responsive TFs with distal elements bound by LEF1 after transfection of NHA with ASCL1 and stimulation with Wnt3a measured by RT-qPCR. Error bars indicate standard error of the mean. (C) A model for cross-talk between aberrantly activated TFs and Wnt signaling in non-stem GBM cells and NHA (top) versus GBM CSCs (bottom). In non-stem GBM cells and NHA, Polycomb complexes repress TFs, including ASCL1. In the absence of ASCL1 protein, the DKK1 upstream regulatory elements is active, the locus is transcribed, and expressed DKK1 inhibits Wnt signaling. In GBM CSCs, Polycomb repression is lost at many TF loci, including ASCL1. ASCL1 binds to the DKK1 regulatory element, thereby repressing DKK1 expression and activating Wnt signaling. Active Wnt signaling feeds back upon loci encoding several other TFs that are aberrantly active in GBM CSCs.

Similar articles

Cited by

References

    1. Balani P, Boulaire J, Zhao Y, Zeng J, Lin J, Wang S. High mobility group box2 promoter-controlled suicide gene expression enables targeted glioblastoma treatment. Mol Ther. 2009;17:1003–1011. - PMC - PubMed
    1. Bao S, Wu Q, McLendon RE, Hao Y, Shi Q, Hjelmeland AB, Dewhirst MW, Bigner DD, Rich JN. Glioma stem cells promote radioresistance by preferential activation of the DNA damage response. Nature. 2006;444:756–760. - PubMed
    1. Barde I, Salmon P, Trono D. Production and titration of lentiviral vectors. Curr Protoc Neurosci. 2010 Chapter 4, Unit 4 21. - PubMed
    1. Baylin SB, Jones PA. A decade of exploring the cancer epigenome - biological and translational implications. Nat Rev Cancer. 2011;11:726–734. - PMC - PubMed
    1. Bell O, Tiwari VK, Thoma NH, Schubeler D. Determinants and dynamics of genome accessibility. Nat Rev Genet. 2011;12:554–564. - PubMed

Publication types

MeSH terms

Associated data