. 2013 Aug 23;425(16):2894-909.
doi: 10.1016/j.jmb.2013.05.013. Epub 2013 May 23.

Partitioning RS domain phosphorylation in an SR protein through the CLK and SRPK protein kinases

Affiliations

Partitioning RS domain phosphorylation in an SR protein through the CLK and SRPK protein kinases

Brandon E Aubol et al. J Mol Biol. .

Abstract

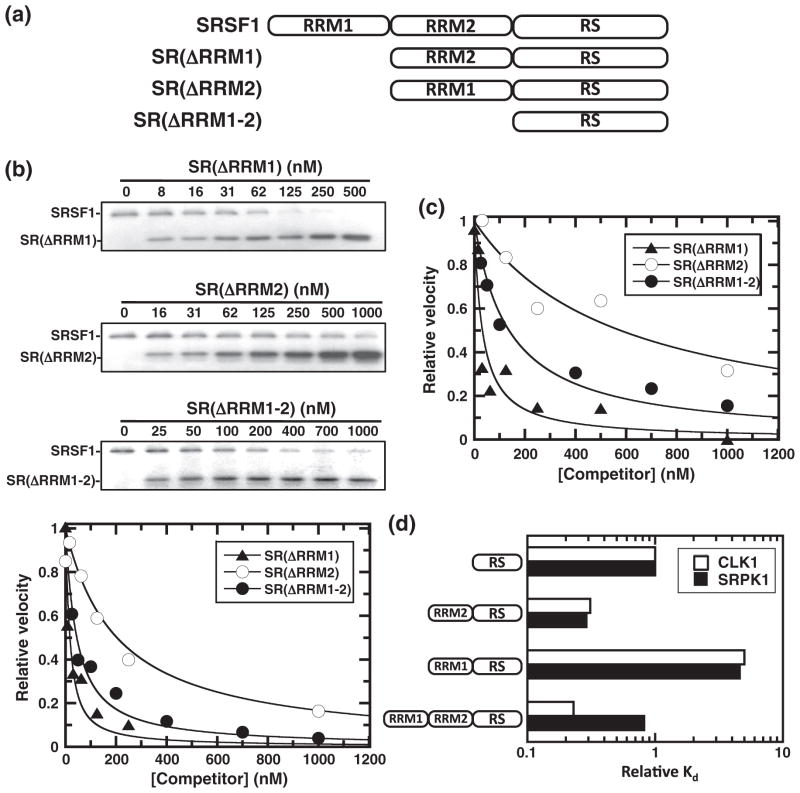
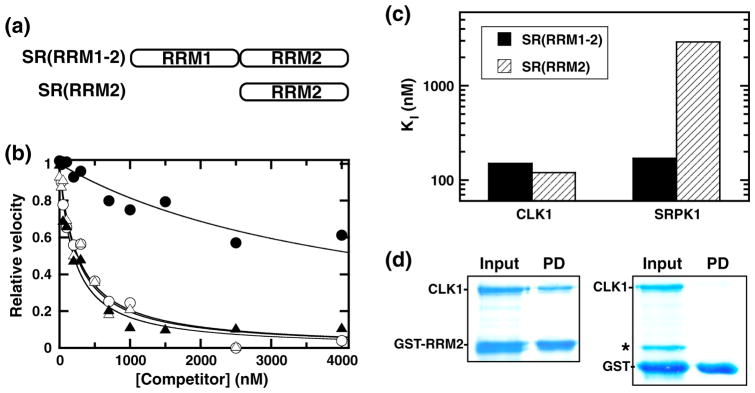
SR proteins are essential splicing factors whose biological function is regulated through phosphorylation of their C-terminal RS domains. Prior studies have shown that cytoplasmic-nuclear translocalization of the SR protein SRSF1 is regulated by multisite phosphorylation of a long Arg-Ser repeat in the N-terminus of the RS domain while subnuclear localization is controlled by phosphorylation of a shorter Arg-Ser repeat along with several Ser-Pro dipeptides in the C-terminus of the RS domain. To better understand how these two kinases partition Arg-Ser versus Ser-Pro specificities, we monitored the phosphorylation of SRSF1 by CLK1 and SRPK1. Although SRPK1 initially binds at the center of the RS domain phosphorylating in an orderly, N-terminal direction, CLK1 makes widespread contacts in the RS domain and generates multiple enzyme-substrate complexes that induce a random addition mechanism. While SRPK1 rapidly phosphorylates N-terminal serines, SRPK1 and CLK1 display similar activities toward Arg-Ser repeats in the C-terminus, suggesting that these kinases may not separate function in a strict linear manner along the RS domain. CLK1 induces a unique gel shift in SRSF1 that is not the result of enhanced Arg-Ser phosphorylation but rather is the direct result of the phosphorylation of several Ser-Pro dipeptides. These prolines are important for binding and phosphorylation of the SR protein by CLK1 but not for the SRPK1-dependent reaction. The data establish a new view of SR protein regulation in which SRPK1 and CLK1 partition activities based on Ser-Pro versus Arg-Ser placement rather than on N- and C-terminal preferences along the RS domain.

Keywords: BSA; CLK; Cdc2-like kinase; NIH; National Institutes of Health; RNA recognition motif; RRM; SR protein; SR-specific protein kinase; SRPK; bovine serum albumin; kinase; kinetics; phosphorylation; splicing.


Figures

Fig. 1
Fig. 1
Regiospecific phosphorylation model controlling SRSF1 nuclear–cytoplasmic localization. Cytoplasmic SRPK1 phosphorylates RS1 in the RS domain allowing nuclear translocation of SRSF1. Nuclear CLK1 then phosphorylates the serines in RS2.
Fig. 2
Fig. 2
Kinetic analysis of SRSF1 phosphorylation by CLK1. (a) Viscometric experiments. The steady-state kinetic parameters kcat with varying ATP (○) or SRSF1 (△) and kcat/Km with varying ATP (●) or SRSF1 (▲) are plotted as relative values in the absence and presence of varying sucrose concentrations versus relative solvent viscosity. Broken lines represent theoretical slope values of 0 and 1. (b) Rapid quench flow experiment. Final concentrations of CLK1, SRSF1 and 32P-ATP are 0.25 μM, 0.5 μM and 100 μM. Production of phosphoproduct normalized to the total CLK1 concentration ([P]/[E]) is fit to a linear function with a slope of 0.08 s−1. (c) Competition experiments. Fixed amounts of SR(ΔRRM1) (50 nM) and 32P-ATP (50 μM) are added to CLK1 (10 nM) or SRPK1 (1 nM) with varying amounts of SRSF1 (competitor), and the reactions are stopped and run on SDS-PAGE. The relative velocities for SR(ΔRRM1) phosphorylation are plotted as a function of total SRSF1, and the appKI values are listed in Table 1.
Fig. 3
Fig. 3
Role of RRMs for CLK1-induced phosphorylation of SRSF1. (a) Deletion constructs. (b) CLK1 competition experiments. Fixed amounts of SRSF1 (50 nM) and 32P-ATP (50 μM) are added to CLK1 (10 nM) with varying amounts of the competitors SR(ΔRRM1), SR(ΔRRM1) and SR(ΔRRM1-2); the reactions are stopped and run on SDS-PAGE. The relative velocities for SRSF1 phosphorylation are plotted as a function of total competitor, and the appKI values are listed in Table 1. (c) SRPK1 competition experiments. Fixed amounts of SRSF1 (50 nM) are added to SRPK1 (1 nM) with varying amounts of the competitors SR(ΔRRM1), SR(ΔRRM1) and SR(ΔRRM1-2); the reactions are stopped and run on SDS-PAGE. The relative velocities for SRSF1 phosphorylation are plotted as a function of total competitor, and the appKI values are listed in Table 1. (d) Bar graph. KI values from Table 1 are plotted for various RRM deletions relative to the RS domain construct SR(ΔRRM1-2) for CLK1 and SRPK1. Values above 1 reflect reductions in binding affinity upon addition of the RRMs, whereas values below 1 reflect increases in affinity.
Fig. 4
Fig. 4
Binding of RRM constructs to CLK1. (a) Deletion constructs. (b) Competition experiments. Fixed amounts of SRSF1 (50 nM) are mixed either with CLK1 (10 nM) and varying amounts of SR(RRM1-2) (△) and SR(RRM2) (▲) or with SRPK1 (1 nM) and varying amounts of SR(RRM1-2) (○) and SR(RRM2) (●). The relative velocities for SRSF1 phosphorylation monitored using a filter-binding assay are plotted as a function of total competitor, and the appKI values are listed in Table 1. (c) Bar graph displaying KI values for SR(RRM1-2) and SR(RRM2) using CLK1 and SRPK1. (d) Pull-down of CLK1 by GST-RRM2. Input contains CLK1 with GST-RRM2 or free GST. Pull-down (PD) contains proteins on G-agarose beads after washing. Starred band represents an impurity, not pulled down by the beads.
Fig. 5
Fig. 5
Residue contacts guiding RS domain interactions with CLK1. (a) Deletion constructs. (b) Effects of C-terminal deletion on CLK1 binding in the presence of RRMs. Phosphorylation of SR(ΔRRM1) (50 nM) using CLK1 (10 nM) was measured as a function of SR(1–219) and SR(1–226), and the appKI values are listed in Table 1. (c) Effects of C-terminal deletion on CLK1 binding in the absence of RRMs. The phosphorylation of SRSF1 (50 nM) using CLK1 (4 nM) was measured as a function of SR(ΔRRM1-2), SR(188–235), SR(188–228) and SR(188–200). The appKI for SRSF1 is 26 ± 4 nM and those for SR(188–235), SR(188–228) and SR(188–200) are listed in Table 1. (d) Effects of C-terminal deletion on SRPK1 binding in the absence of RRMs. The phosphorylation of SR(ΔRRM1) (50 nM) using SRPK1 (2 nM) was measured as a function of SR(ΔRRM1-2), SR(188–235), SR(188–228) and SR(188–200); the appKI values are listed in Table 1. (e) Bar graph showing KI values for deletion constructs lacking RRMs.
Fig. 6
Fig. 6
Effects of proline mutations on SRSF1 binding and phosphorylation. (a) Mutations in RS domain prolines. Residues phosphorylated by SRPK1 are highlighted with brackets. (b) Single turnover kinetics. CLK1 (0.5 μM) and 100 μM 32P-ATP are added to 0.2 μM SRSF1 (●), SR(P200A) (○), SR(P228A) (▲), SR(P235A) (△), SR(P239A) (■), SR(P228,235A) (□), SR(P200,228,235A) (▼) and SR(P235,239A) (▽). The data are fit to a single exponential to obtain rate constants and amplitudes of 0.60 ± .08 min−1 and 18 ± 0.6 for SRSF1, 0.44 ± .05 min−1 and 16 ± 0.6 for SR(P200A), 0.34 ± .06 min−1 and 15 ± 0.6 for SR(P228A), 0.58 ± .04 min−1 and 19 ± 0.4 for SR(P235A), 0.41 ± .02 min−1 and 20 ± 0.4 for SR(P228,235A), 0.25 ± .02 min−1 and 13 ± 0.39 for SR(P200,228,235A) and 0.26 ± .02 min−1 and 17 ± 0.34 for SR(P235,239A), respectively. SR(P239A) was fit to a double exponential with amplitudes of 5 ± 0.4 and 15 ± 0.4 sites and rate constants of 1.1 ± .25 and 0.034 ± 0.002 min−1, respectively. (c) Bar graph showing phosphoryl contents of mutants. Data are taken from the total amplitudes in (b). (d and e) Competition experiments for mutants using SRPK1 (d) and CLK1 (e). Fixed amounts of SR(ΔRRM1) (50 nM) are mixed with either CLK1 (10 nM) or SRPK1 (1 nM) and varying amounts of mutant SR proteins. Mutants are labeled as in (b), and the appKI and KI values are displayed in Table 1. (f) Bar graph showing KI values for the mutants relative to SRSF1 for CLK1 and SRPK1.
Fig. 7
Fig. 7
Gel-shift analyses of Ser-Pro mutants of SRSF1. (a) Progress curves for SRSF1 phosphorylation by SRPK1 (●) or CLK1 (▲). SRPK1 (1 μM) or CLK1 (0.5 μM) is preequilibrated with 0.2 μM SRSF1 and reacted with 100 μM 32P-ATP. The data for SRPK1 are fit to a double exponential with amplitudes of 11 ± 1 and 4 ± 1 sites and rate constants of 5 ± 4 and 0.3 ± 0.1 min−1. The data for CLK1 are fit to a single exponential with an amplitude and rate constant of 18 ± 0.5 sites and 0.65 ± 0.04 min−1. (b) Mutations in Ser-Pro dipeptides of RS domain. Residues 227–248 of the RS domain are displayed. (c) Single turnover kinetics. CLK1 (0.5 μM) and SR protein (0.2 μM) are mixed with 100 μM 32P-ATP, and the total number of sites is plotted as a function of time. Data are fit to single exponential functions to obtain amplitudes and rate constants of 18 ± 0.4 and 0.44 ± 0.04 min−1 for SR(S227A) (○), 17 ± 0.85 and 0.62 ± 0.10 min−1 for SR(S234A) (△), 18 ± 0.50 and 0.61 ± 0.071 min−1 for SR(S238A) (□) and 13 ± 0.40 and 0.34 ± 0.022 min−1 for SR(S227,234,238A) (■), respectively. (d) Kinetic analyses of gel shift. CLK1 (0.5 μM) and SRSF1 or SR(S227,234,238A) (TM) are mixed with 100 μM 32P-ATP, and the reaction is stopped at various time points and run on a 10% SDS-PAGE. (e) Effects of phosphorylation on mobility of single mutants. CLK1 (0.5 μM) and SR protein (0.2 μM) are mixed with 100 μM 32P-ATP, and the reaction is stopped after 30 min and run on an 10% SDS-PAGE.
Fig. 8
Fig. 8
Model for CLK1- and SRPK1-dependent phosphorylation of SRSF1. (a) SRPK1 uses a docking groove to orient the RS domain and induce C-to-N-terminal phosphorylation. (b) CLK1 likely allows several bound forms of the RS domain to induce random phosphorylation. (c) Model for interplay of SRPK1 and CLK1 activities on SRSF1. Black regions in the RS domain are rich in Arg-Ser repeats and divided into N- and C-terminal repeats (RS-N and RS-C). Red region is rich in Ser-Pro dipeptides.

References

    1. Stojdl DF, Bell JC. SR protein kinases: the splice of life. Biochem Cell Biol. 1999;77:293–298. - PubMed
    1. Ghosh G, Adams JA. Phosphorylation mechanism and structure of serine-arginine protein kinases. FEBS J. 2011;278:587–597. - PMC - PubMed
    1. Yeakley JM, Tronchere H, Olesen J, Dyck JA, Wang HY, Fu XD. Phosphorylation regulates in vivo interaction and molecular targeting of serine/arginine-rich pre-mRNA splicing factors. J Cell Biol. 1999;145:447–455. - PMC - PubMed
    1. Lai MC, Lin RI, Huang SY, Tsai CW, Tarn WY. A human importin-β family protein, transportin-SR2, interacts with the phosphorylated RS domain of SR proteins. J Biol Chem. 2000;275:7950–7957. - PubMed
    1. Mathew R, Hartmuth K, Mohlmann S, Urlaub H, Ficner R, Luhrmann R. Phosphorylation of human PRP28 by SRPK2 is required for integration of the U4/U6-U5 tri-snRNP into the spliceosome. Nat Struct Mol Biol. 2008;15:435–443. - PubMed

Publication types

MeSH terms