

Cytochrome c oxidase response to changes in cerebral oxygen delivery in the adult brain shows higher brain-specificity than haemoglobin
- PMID: 23707584
- PMCID: PMC3898943
- DOI: 10.1016/j.neuroimage.2013.05.070
Cytochrome c oxidase response to changes in cerebral oxygen delivery in the adult brain shows higher brain-specificity than haemoglobin
Abstract
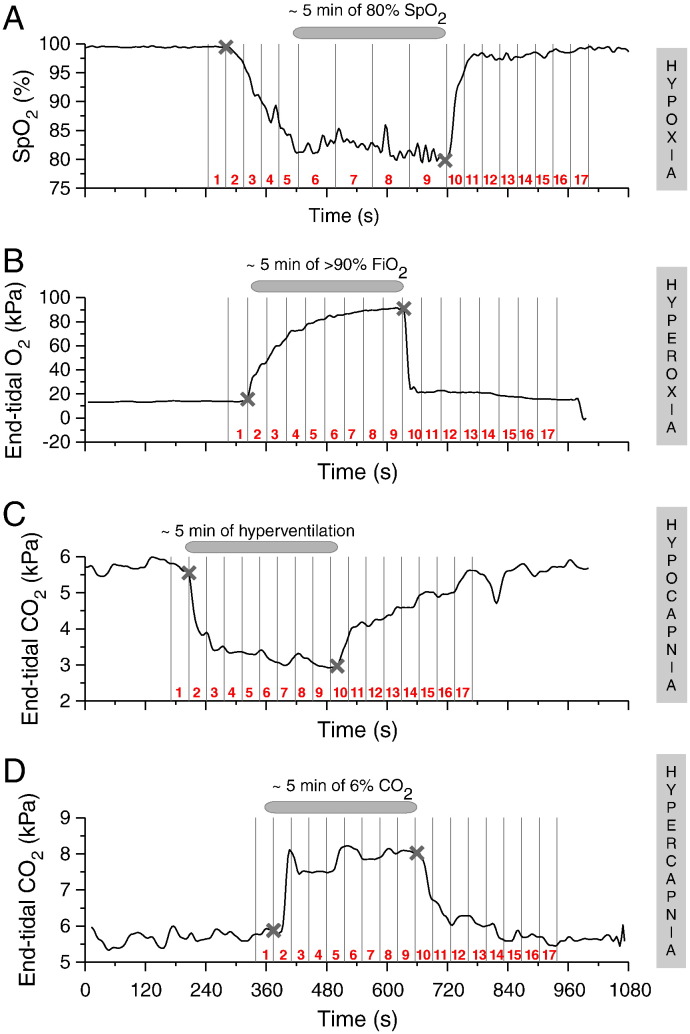
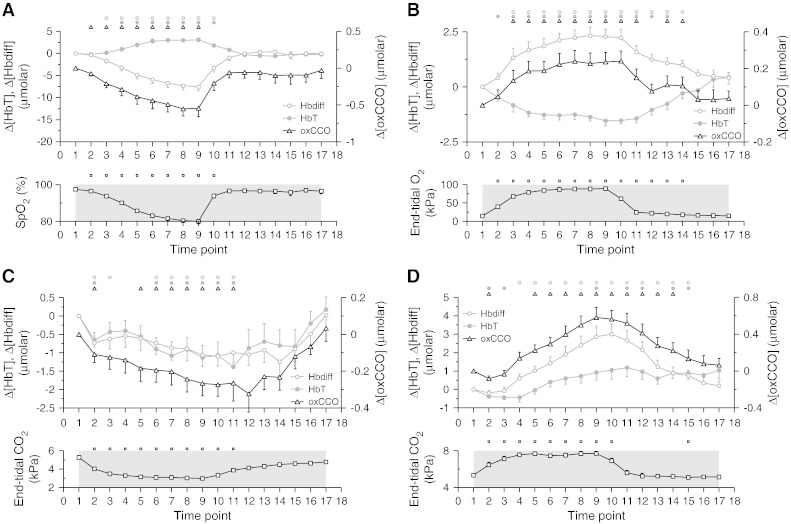
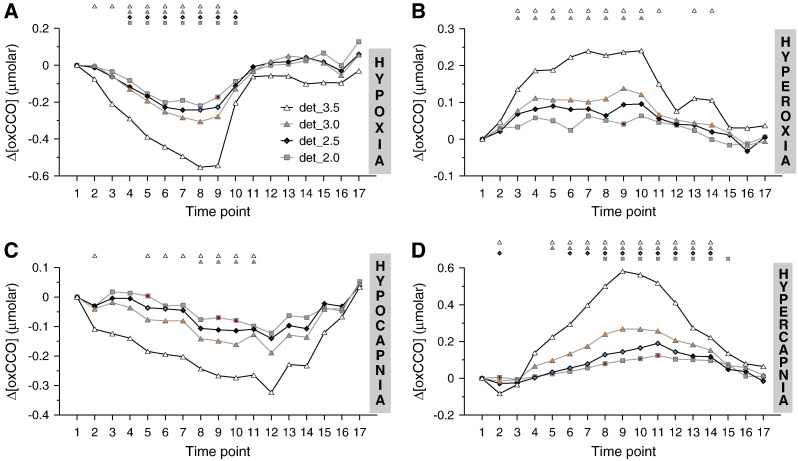
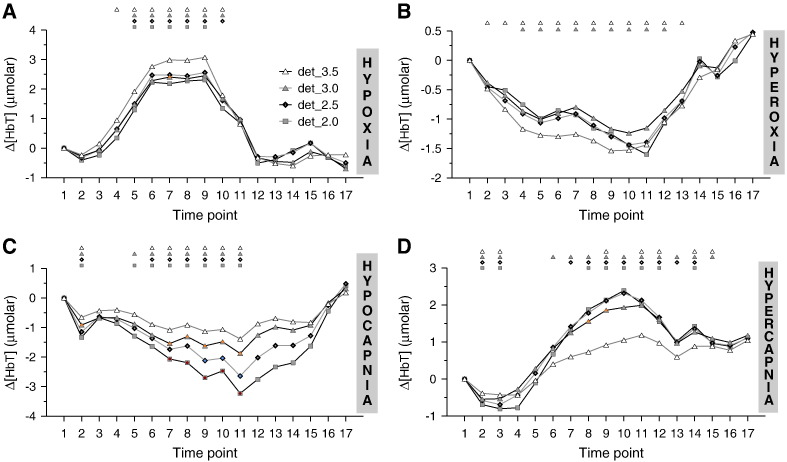
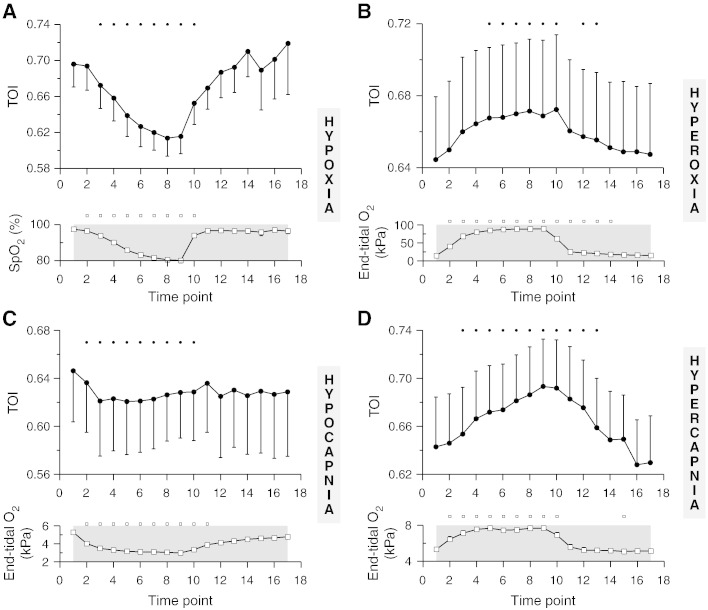
The redox state of cerebral mitochondrial cytochrome c oxidase monitored with near-infrared spectroscopy (Δ[oxCCO]) is a signal with strong potential as a non-invasive, bedside biomarker of cerebral metabolic status. We hypothesised that the higher mitochondrial density of brain compared to skin and skull would lead to evidence of brain-specificity of the Δ[oxCCO] signal when measured with a multi-distance near-infrared spectroscopy (NIRS) system. Measurements of Δ[oxCCO] as well as of concentration changes in oxygenated (Δ[HbO2]) and deoxygenated haemoglobin (Δ[HHb]) were taken at multiple source-detector distances during systemic hypoxia and hypocapnia (decrease in cerebral oxygen delivery), and hyperoxia and hypercapnia (increase in cerebral oxygen delivery) from 15 adult healthy volunteers. Increasing source-detector spacing is associated with increasing light penetration depth and thus higher sensitivity to cerebral changes. An increase in Δ[oxCCO] was observed during the challenges that increased cerebral oxygen delivery and the opposite was observed when cerebral oxygen delivery decreased. A consistent pattern of statistically significant increasing amplitude of the Δ[oxCCO] response with increasing light penetration depth was observed in all four challenges, a behaviour that was distinctly different from that of the haemoglobin chromophores, which did not show this statistically significant depth gradient. This depth-dependence of the Δ[oxCCO] signal corroborates the notion of higher concentrations of CCO being present in cerebral tissue compared to extracranial components and highlights the value of NIRS-derived Δ[oxCCO] as a brain-specific signal of cerebral metabolism, superior in this aspect to haemoglobin.
Keywords: Cytochrome c oxidase; Hypercapnia; Hyperoxia; Hypocapnia; Hypoxia; Near-infrared spectroscopy.
Copyright © 2013 Elsevier Inc. All rights reserved.
Figures
Similar articles
-
Dependence on NIRS source-detector spacing of cytochrome c oxidase response to hypoxia and hypercapnia in the adult brain.Adv Exp Med Biol. 2013;789:353-359. doi: 10.1007/978-1-4614-7411-1_47. Adv Exp Med Biol. 2013. PMID: 23852515 Free PMC article.
-
Spatial Distribution of Changes in Oxidised Cytochrome C Oxidase During Visual Stimulation Using Broadband Near Infrared Spectroscopy Imaging.Adv Exp Med Biol. 2016;923:195-201. doi: 10.1007/978-3-319-38810-6_26. Adv Exp Med Biol. 2016. PMID: 27526143 Free PMC article.
-
Functional NIRS Measurement of Cytochrome-C-Oxidase Demonstrates a More Brain-Specific Marker of Frontal Lobe Activation Compared to the Haemoglobins.Adv Exp Med Biol. 2017;977:141-147. doi: 10.1007/978-3-319-55231-6_19. Adv Exp Med Biol. 2017. PMID: 28685438 Free PMC article.
-
Brain mitochondrial oxidative metabolism during and after cerebral hypoxia-ischemia studied by simultaneous phosphorus magnetic-resonance and broadband near-infrared spectroscopy.Neuroimage. 2014 Nov 15;102 Pt 1:173-83. doi: 10.1016/j.neuroimage.2013.08.016. Epub 2013 Aug 17. Neuroimage. 2014. PMID: 23959202 Free PMC article. Review.
-
Measurement of cytochrome oxidase and mitochondrial energetics by near-infrared spectroscopy.Philos Trans R Soc Lond B Biol Sci. 1997 Jun 29;352(1354):669-76. doi: 10.1098/rstb.1997.0048. Philos Trans R Soc Lond B Biol Sci. 1997. PMID: 9232854 Free PMC article. Review.
Cited by
-
Inhibiting responses under the watch of a recently synchronized peer increases self-monitoring: evidence from functional near-infrared spectroscopy.Open Biol. 2024 Feb;14(2):230382. doi: 10.1098/rsob.230382. Epub 2024 Feb 21. Open Biol. 2024. PMID: 38378138 Free PMC article.
-
Up-regulation of cerebral cytochrome-c-oxidase and hemodynamics by transcranial infrared laser stimulation: A broadband near-infrared spectroscopy study.J Cereb Blood Flow Metab. 2017 Dec;37(12):3789-3802. doi: 10.1177/0271678X17691783. Epub 2017 Feb 9. J Cereb Blood Flow Metab. 2017. PMID: 28178891 Free PMC article.
-
The influence of carbon dioxide on cerebral metabolism and oxygen consumption: combining multimodal monitoring with dynamic systems modelling.Biol Open. 2024 Jan 15;13(1):bio060087. doi: 10.1242/bio.060087. Epub 2024 Jan 5. Biol Open. 2024. PMID: 38180242 Free PMC article.
-
Analysis of slow wave oscillations in cerebral haemodynamics and metabolism following subarachnoid haemorrhage.Adv Exp Med Biol. 2014;812:195-201. doi: 10.1007/978-1-4939-0620-8_26. Adv Exp Med Biol. 2014. PMID: 24729233 Free PMC article.
-
Towards a wearable near infrared spectroscopic probe for monitoring concentrations of multiple chromophores in biological tissue in vivo.Rev Sci Instrum. 2016 Jun;87(6):065112. doi: 10.1063/1.4954722. Rev Sci Instrum. 2016. PMID: 27370501 Free PMC article.
References
-
- Aletti F., Re R., Pace V., Contini D., Molteni E., Cerutti S., Maria Bianchi A., Torricelli A., Spinelli L., Cubeddu R., Baselli G. Deep and surface hemodynamic signal from functional time resolved transcranial near infrared spectroscopy compared to skin flowmotion. Comput. Biol. Med. 2012;42:282–289. - PubMed
-
- Al-Rawi P.G., Smielewski P., Kirkpatrick P.J. Evaluation of a near-infrared spectrometer (NIRO 300) for the detection of intracranial oxygenation changes in the adult head. Stroke. 2001;32:2492–2500. - PubMed
Publication types
MeSH terms
Substances
Grants and funding
LinkOut - more resources
Full Text Sources
Other Literature Sources
