Review
. 2013 Oct 15:80:360-78.
doi: 10.1016/j.neuroimage.2013.05.079. Epub 2013 May 24.

Dynamic functional connectivity: promise, issues, and interpretations

Affiliations
Review

Dynamic functional connectivity: promise, issues, and interpretations

R Matthew Hutchison et al. Neuroimage. .

Abstract

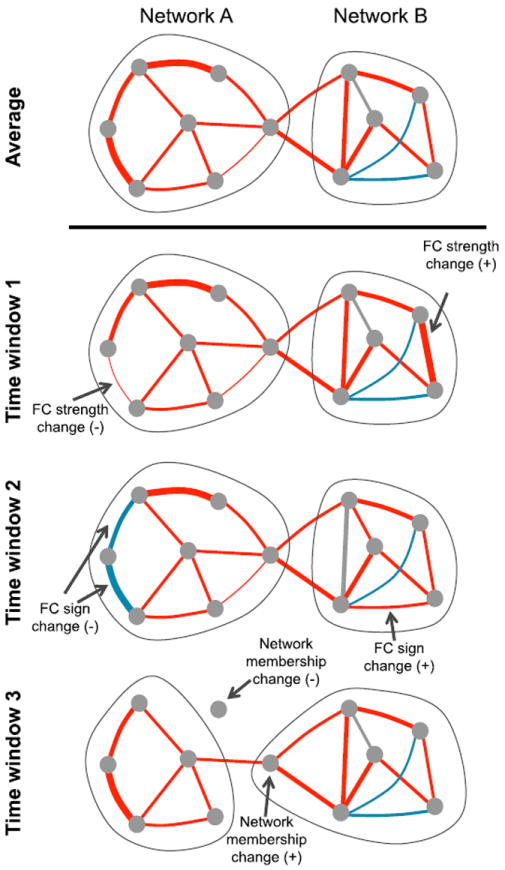
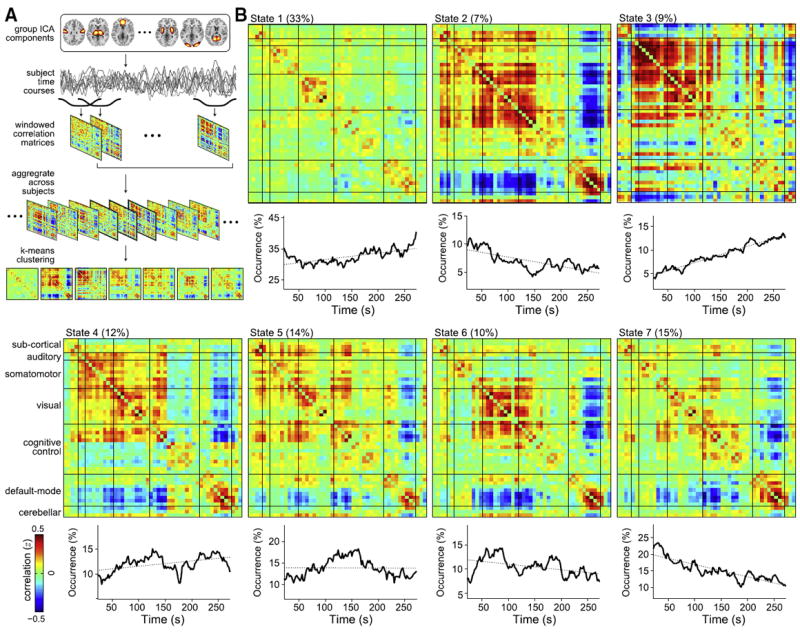
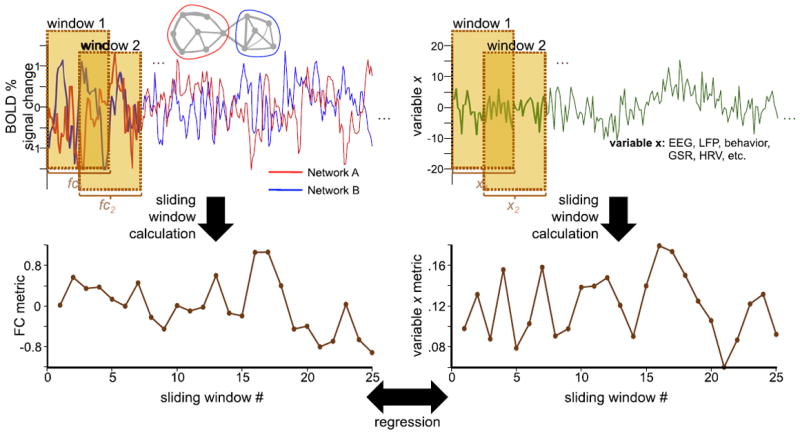
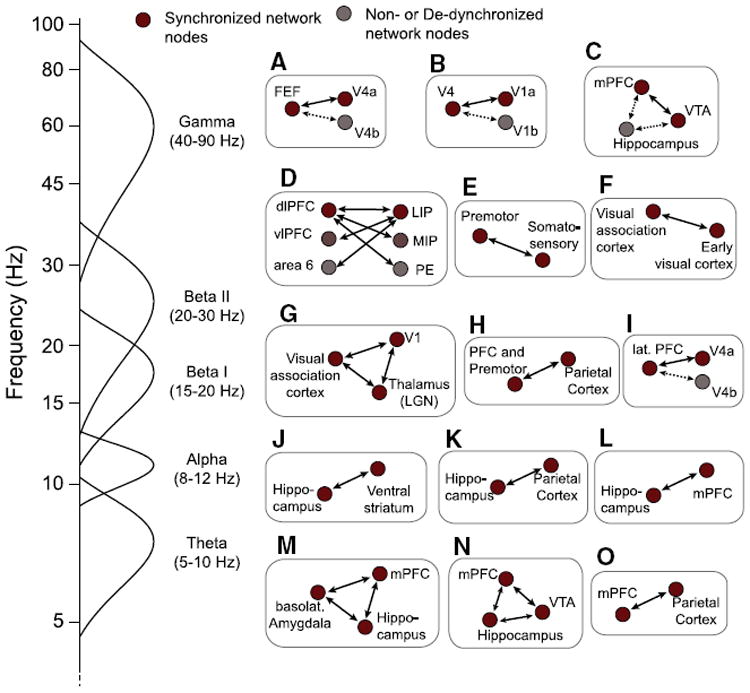
The brain must dynamically integrate, coordinate, and respond to internal and external stimuli across multiple time scales. Non-invasive measurements of brain activity with fMRI have greatly advanced our understanding of the large-scale functional organization supporting these fundamental features of brain function. Conclusions from previous resting-state fMRI investigations were based upon static descriptions of functional connectivity (FC), and only recently studies have begun to capitalize on the wealth of information contained within the temporal features of spontaneous BOLD FC. Emerging evidence suggests that dynamic FC metrics may index changes in macroscopic neural activity patterns underlying critical aspects of cognition and behavior, though limitations with regard to analysis and interpretation remain. Here, we review recent findings, methodological considerations, neural and behavioral correlates, and future directions in the emerging field of dynamic FC investigations.

Keywords: Dynamics; Fluctuations; Functional MRI (fMRI); Functional connectivity; Resting state; Spontaneous activity.


Conflict of interest statement

Conflict of interest

The authors declare no conflicts of interest.

Figures

Fig. 1
Fig. 1
Time-varying changes in functional connectivity (FC). The schematic graph representation illustrates possible changes in connectivity properties (row 1). The FC strength between two nodes can change in magnitude (row 2), sign (row 3), or be lost/gained as the strength changes above or below a threshold, such that the node membership changes (row 3). Red edges, positive connections; blue edges, negative connections.
Fig. 2
Fig. 2
Detection of functional connectivity (FC) states with a sliding window/clustering approach. (A) An overview of the analysis. Group ICA is used to decompose resting-state data into intrinsic networks. Correlation matrices are computed from windowed portions of each subject’s component time series and the matrices are aggregated across subjects. K-means clustering is applied to the correlation matrices to find repeating patterns of connectivity, referred to as FC states. (B) Cluster centroids for FC States 1–7 show patterns in connectivity that are not apparent from stationary models. Below each centroid is the number of occurrences (in percentage units) of the state as a function of time. Linear fits (dotted lines) suggest a prominent increase in the appearance of State 3 over time, and decreases in the appearance of States 2 and 7. Adapted with permission from Allen et al. (in press).
Fig. 3
Fig. 3
Evaluating the relationship between sliding-window functional connectivity (FC) and a concurrently measured variable. A sliding-window FC analysis is performed on pairs of BOLD signal time series, here derived from two networks “A” and “B” (upper left), producing a sequence of sliding-window FC values (lower left). Similarly, measurements of a neural, physiological, or behavioral variable “x” (upper right) can be computed in identical sliding windows (lower right). The two sliding window time series can then be compared using methods such as linear regression, as one way of determining whether the observed BOLD FC dynamics may be associated with variable “x”. EEG, electroencephalography; GSR, galvanic skin response; HRV, heart rate variability, LFP, local field potentials.
Fig. 4
Fig. 4
Overview of recently described functional networks emerging at fast time scales during specific cognitive states in large-scale synchronized local field potential (LFP) activity in animal studies. Each panel (A–H) sketches the brain areas that have been shown to engage in spatially selective coherent long-range networks during states that index visual attention, working memory, reward expectancies, memory retrieval, or sensorimotor integration. For the majority of examples coherent LFP states translated into synchronized spiking activity of individual cells. The selective overview of recently published example networks is described in detail in: A: Gregoriou et al. (2009), B: Bosman et al. (2012), Grothe et al. (2012), C: Fujisawa and Buzsaki (2011), D: Salazar et al. (2012), E: Brovelli et al. (2004), von Stein et al. (2000), Palva et al. (2010), F: Womelsdorf et al. (2007), G: Hughes et al. (2011), H: Pesaran et al. (2008), I: Liebe et al. (2012), J: Lansink et al. (2009), DeCoteau et al. (2007), K: Sirota et al. (2008), L: Benchenane et al. (2010), M: Popa et al. (2010), Lesting et al. (2011), N: Fujisawa and Buzsaki (2011), and O: Phillips et al. (in press). The sketched frequency axis (left) indicates the frequency range of the observed networks. For broadly distributed, selective neocortical and cortico–thalamic networks emerging at infra-slow (<0.3 Hz), slow (0.3–1 Hz), and delta (1–4 Hz) frequencies see, e.g., Timofeev et al. (2012).
Fig. 5
Fig. 5
A) Spatial topography of MEG RSNs obtained in network-specific epochs of high internal connectivity (maximal correlation windows — MCWs): yellow: DAN; cyan: DMN; pink: ventral attention network (VAN); red: visual (VIS); green: somatomotor (MOT); orange: language (LAN); white: voxels shared across different networks. B) Left: within-MCW cross-network interaction estimated from the BLP in the β band. The matrix is not symmetric because the interaction is estimated for each network (row) during its respective MCWs. When internal connectivity is high, the DMN is the most strongly interacting network. Right: the DMN is strongly internally correlated (thick blue lines). Internal correlation within the DAN (red) is reduced and partially de-coupled (thin dotted red lines). Some nodes in the DAN (e.g., left PIPS) couple with nodes of the DMN (e.g., PCC) (thick green lines). C) Left: during periods outside MCWs, the overall interaction of the DMN with other networks (in the β band) is reduced and its centrality is no longer evident. Right: when the DMN’s internal connectivity is low, the DAN can have strong within-network connectivity, but little integration with other nodes or network occurs. Adapted with permission from de Pasquale et al. (2012).
Fig. 6
Fig. 6
Proposed scheme of subnetwork modulation of deep layer cells by amplitude variations of beta oscillations. A) Canolty et al. (2012) have shown that in deep cortical layers, there is a highly robust sigmoidal relation between the firing rate of single cells and the amplitude of beta local field potential oscillations. Some cells (cells 1 and 2) have high firing rates during high beta amplitudes (gray shading, left panel), while other cells (cells 3 and 4) have a higher firing rate during suppressed beta amplitudes (gray shading, right panel). The amplitude-to-rate mapping is consistent across recording sessions. B) The cell-specific amplitude-to-rate mapping suggests that a state of high beta amplitude (left panels) coincides with the activation of a selected subnetwork of deep layer cells. When the beta amplitude changes, the subnetwork of cells with high firing rate switches (right panels). This hypothesis predicts that modulation of local oscillatory power indexes a change in the active projection sites, and a corresponding change in long-range functional network connectivity.

References

    1. Abou-Elseoud A, Starck T, Remes J, Nikkinen J, Tervonen O, Kiviniemi V. The effect of model order selection in group PICA. Hum Brain Mapp. 2010;31:1207–1216. - PMC - PubMed
    1. Adelstein JS, Shehzad Z, Mennes M, Deyoung CG, Zuo XN, Kelly C, Margulies DS, Bloomfield A, Gray JR, Castellanos FX, Milham MP. Personality is reflected in the brain’s intrinsic functional architecture. PLoS One. 2011;6:e27633. - PMC - PubMed
    1. Akam T, Kullmann DM. Oscillations and filtering networks support flexible routing of information. Neuron. 2010;67:308–320. - PMC - PubMed
    1. Albert NB, Robertson EM, Miall RC. The resting human brain and motor learning. Curr Biol. 2009;19:1023–1027. - PMC - PubMed
    1. Allen JJ, Cohen MX. Deconstructing the “resting” state: exploring the temporal dynamics of frontal alpha asymmetry as an endophenotype for depression. Front Hum Neurosci. 2010;4:232. - PMC - PubMed

Publication types