. 2013 Jun 10;23(6):725-38.
doi: 10.1016/j.ccr.2013.04.009. Epub 2013 May 23.

Control of alveolar differentiation by the lineage transcription factors GATA6 and HOPX inhibits lung adenocarcinoma metastasis

Affiliations

Control of alveolar differentiation by the lineage transcription factors GATA6 and HOPX inhibits lung adenocarcinoma metastasis

William K C Cheung et al. Cancer Cell. .

Abstract

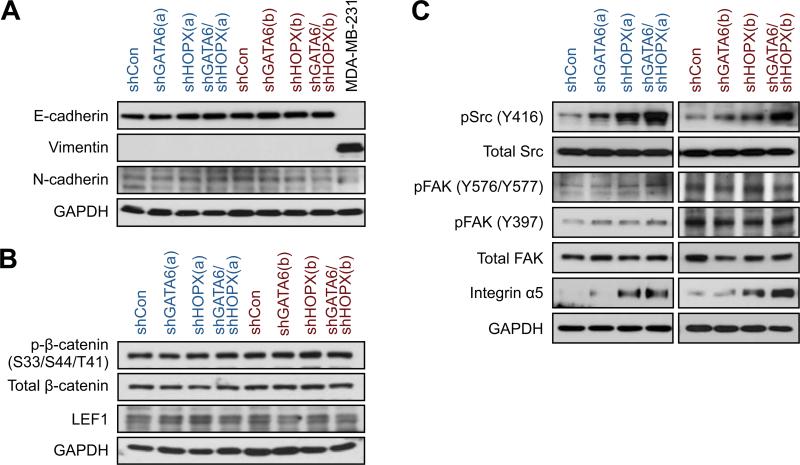
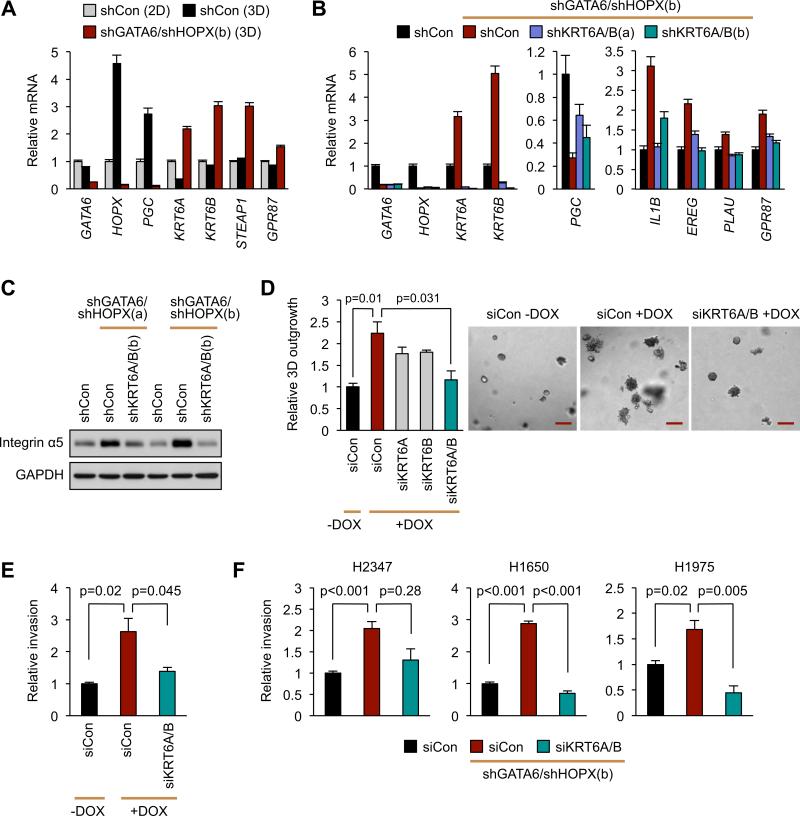
Molecular programs that mediate normal cell differentiation are required for oncogenesis and tumor cell survival in certain cancers. How cell-lineage-restricted genes specifically influence metastasis is poorly defined. In lung cancers, we uncovered a transcriptional program that is preferentially associated with distal airway epithelial differentiation and lung adenocarcinoma (ADC) progression. This program is regulated in part by the lineage transcription factors GATA6 and HOPX. These factors can cooperatively limit the metastatic competence of ADC cells, by modulating overlapping alveolar differentiation and invasogenic target genes. Thus, GATA6 and HOPX are critical nodes in a lineage-selective pathway that directly links effectors of airway epithelial specification to the inhibition of metastasis in the lung ADC subtype.


Figures

Figure 1
Figure 1. Expression of an alveolar-like gene module correlates with lung ADC patient outcome
(A) Hierarchical clustering was performed on primary ADCs from the NCI Director's Challenge Cohort (DCC; n=442) based on 249 genes that mark AT2 cell differentiation and airway homeostasis. The heatmap represents tumors clustered into “DASC-like” or “alveolar-like” subsets. (B) Gene set enrichment analysis showing the similarities between activated genes in “DASC-like” tumors and distal airway stem cells. NES=normalized enrichment score. (C) Frequency of poorly, moderately, or well differentiated stage I tumors within the “alveolar-like” and “DASC-like” groups. (D) Normalized log2 expression values of epithelial lineage markers in stage I ADCs in DCC tumors. Data presented as a Box-whisker plot (5-95%). p-values calculated by Student's t-test with Bonferroni correction. ns=not significant. (E) Kaplan-Meier curves for the overall survival of DCC patients classified as in (A). p-values calculated by log-rank test. (F) NSCLCs from the Duke Medical Center were classified as in (A), and survival plotted for patients with ADC (green and red curves) versus SCC (black and grey curves). p-values calculated by log-rank test. See also Figure S1 and Table S1.
Figure 2
Figure 2. TF activity and expression in DASC-like tumors and metastatic ADC cells
(A) Annotated cis TF motifs from TRANSFAC database were computed for enrichment in the transcriptome of ADC subsets. The heatmap depicts motifs that are significantly over (orange) or under-represented (blue) in “DASC like” ADCs from 4 independent patient cohorts. Enrichment scores based on -log10(p-value) from GSEA. (B) Normalized log2 values for GATA6 and HOPX expression in DCC. p-values calculated by Student's t-test with Bonferroni correction. (C) GATA6 and HOPX were measured in the indicated cell lines via real time quantitative RT-PCR (qRT-PCR). U.D=undetected. Bar charts represent the mean ± SEM. (D) Western blot of GATA6 and HOPX in the indicated cell lines. (E) Normalized log2 values of Gata6 and Hopx expression in non-metastatic primary (TnonMet: n=7), metastatic primary (Tmet; n=7) and metastases (Met; n=9) cell lines derived from a KrasLSL-G12D/+;p53flox/flox lung ADC mouse model. p-values calculated by Student's t-test with Bonferroni correction. (F) Survival of DCC patients based on the median expression of GATA6 and HOPX in their primary tumors. p-values calculated by log-rank test. Hazard ratio (HR) and confidence interval calculated using patient sex, smoking status, and tumor stage as covariates. See also Figure S2 and Table S2.
Figure 3
Figure 3. The lineage TFs GATA6 and HOPX limit metastatic colonization
(A) H2030 cells stably expressing two separate doxycycline (DOX) inducible shRNAs, (a) or (b), against GATA6 were cultured in the absence or presence of DOX. GATA6 level was measured by qRT-PCR. (B) H2030 cells from (A) were injected at indicated cell numbers into the arterial circulation of mice fed with regular (-DOX) or DOX (+DOX) diet. Metastatic burden was measured by bioluminescent imaging. The bar chart shows the whole body bioluminescent units (BLU) collected at Day 36 (shGATA6(a)) or Day 40 (shGATA6(b)) and normalized to Day 0. Right: representative images of mice injected with H2030-shGATA6(a) cells on Day 36. p-values calculated by Mann-Whitney test. (C) 5 × 10⁴ H2030-BrM3 cells overexpressing GATA6, HOPX, or both were injected as in (B). The scatter plot shows the metastatic burden at Day 42. p-values calculated by Mann-Whitney test. (D) qRT-PCR of GATA6 and HOPX in PC9 cells expressing the indicated shRNAs. shCon: a control shRNA. (E) 5 × 10⁴ PC9 cells expressing the indicated shRNAs were injected intracardially into DOX treated mice. The scatter plot shows the metastatic burden at Day 48. Bottom: representative images of mice with metastases. p-values calculated by Mann-Whitney test. (F) Kaplan-Meier curve showing the metastasis free survival of mice inoculated with 2.5 × 10⁴ PC9-shGATA6/shHOPX(b) cells as in (B) or injected with PC9-shGATA6/shHOPX(b) cells that co-express GATA6 and HOPX cDNAs (+Rescue). p-values calculated by log-rank test. (G) Hematoxylin and eosin staining of metastases in the (a) brain, (b) bone and (c) lung of mice harvested from (E). Scale bars, 100 μm. (H) Volumes of subcutaneous tumors formed by PC9-shGATA6/shHOPX(a) cells. Mean ± SEM. p-values calculated by Student's t-test. ns= not significant. All bar charts represent the mean ± SEM. See also Figure S3.
Figure 4
Figure 4. GATA6 and HOPX do not affect tumor cell survival
(A) H2030 cells with the indicated shRNAs were cultured in media containing 0.2% serum. Cell viability was measured at 72 hr after DOX treatment. (B) The viability of PC9 cells with the indicated shRNAs was measured in media supplemented with 10% or 0.2% FBS as in (A). (C) The indicated PC9 cell lines were transfected with siRNA targeting GATA2 (siGATA2). Cell viability was measured in 0.2% FBS at Day 5 post-transfection. All bar charts represent the mean ± SEM. See also Figure S4.
Figure 5
Figure 5. GATA6 and HOPX constrain cell invasion
(A) PC9 cells expressing the indicated shRNAs were cultured in low attachment plates with media containing Matrigel and DOX. Phase contrast images were captured after 14 days of culture. The inset shows a cross section of a DAPI stained organoid. Scale bars, 200 μm (25 μm in insert). (B) Organoids from (A) were harvested and cell outgrowth was measured as a function of luciferase activity. (C) The bar chart shows the percentage of mass (black), grape-like (teal) and expansive (red) organoids. The numbers at the top of graph show the overall numbers (± SEM) of tumor organoids formed at Day 8. Representative images of indicated organoids are shown at right. Scale bars, 100 μm. (D) After 14 days of 3D culture in the presence of DOX, PC9-shGATA6/shHOPX(b) organoids were re-plated in Matrigel with (+DOX) or without DOX (Off-Dox) for an additional 18 - 24 days. Tumor cell growth was measured at Day 32 and 38 as in (B). Representative images at Day 32 are shown. The red fluorescent protein (RFP) signal indicates shRNA expression. Scale bars, 200 μm. (E) At Day 14, PC9-shGATA6/shHOPX(b) organoids formed in Matrigel in the presence or absence of DOX were disaggregated and subjected to invasion assay in Boyden chambers. (F) PC9 cells expressing the indicated shRNAs were grown in monolayer with DOX for 5 days and then directly subjected to an invasion assay as in (E). Quantification was normalized to the invasion of cells expressing shCon. (G) Invasion of additional ADC lines was determined as in (F). All bar charts represent the mean ± SEM. p-values calculated by Student's t-test. See also Figure S5.
Figure 6
Figure 6. Src and integrin α5 are suppressed by GATA6 and HOPX
PC9 cells with the indicated shRNAs targeting GATA6 and/or HOPX were cultured in monolayer. After 5 days of DOX treatment, cells were harvested for western blot analysis for (A) epithelial (E-cadherin) and mesenchymal (Vimentin and N-cadherin) markers; (B) canonical WNT signaling pathway components, β-catenin and LEF1; (C) Src, FAK, and integrin α5. Lysate from MDA-MB-231 cells serves as a control for vimentin. See also Figure S6.
Figure 7
Figure 7. Common regulation of airway differentiation and metastasis gene sets
(A) Pearson correlation coefficients were calculated for each DCC tumor by comparing its mRNA transcriptome to the shGATA6/shHOPX knockdown signature generated by RNA-sequencing of PC9 cells. DCC tumors were ordered from lowest to highest correlation with shGATA6/shHOPX knockdown cells (top). Histological and molecular subtypes are annotated in the middle and bottom rows for comparisons. DASC-like samples have a higher correlation with GATA6/HOPX knockdown cells than with alveolar-like tumors (middle row; p-value by Student's t-test). Squamoid and magnoid tumors have a higher correlation than bronchioid tumors (bottom row; p-value by ANOVA). (B) Left: the heatmap depicts 426 genes that are commonly up-regulated (red) or down-regulated (green) in shGATA6/shHOPX knockdown cells and DCC tumors. Right: top 50 up- and down-regulated genes. Genes that were validated by qRT-PCR are denoted with rectangles. Blue=controlled by HOPX. Grey=redundantly controlled by GATA6 and HOPX. Red=cooperatively controlled by GATA6 and HOPX. *=Confirmation of HOPX and GATA6 knockdown. (C) qRT-PCR measurement of alveolar (SFTPD and PGC), basal (KRT6A and KRT6B) and neuroendocrine (SCG2) marker expression in DOX treated PC9 cells with the indicated shRNAs. (D) qRT-PCR measurement of the expression of known metastasis genes. For qRT-PCR data, expression was normalized to PC9-shCon cells and presented as the mean ± SEM. See also Figure S7 and Table S3.
Figure 8
Figure 8. GATA6 and HOPX link epithelial identity with invasion through KRT6A and KRT6B
(A) PC9 cells with the indicated shRNAs were cultured in monolayer (2D) or Matrigel suspension (3D) for 5 days as in Figure 5. Expression of the indicated lung epithelial markers was detected by qRT-PCR. (B) PC9-shGATA6/shHOPX(b) knockdown cells were super-infected with lentiviruses encoding shCon or shRNAs against KRT6A and KRT6B. Expression of the indicated GATA6/HOPX target genes upon KRT6A/B suppression was detected by qRT-PCR. (C) Western blot showing integrin α5 protein levels in the indicated cell lines. (D) PC9-shGATA6/shHOPX(b) cells were transfected with the indicated siRNAs and cultured in 3D. Tumor cell outgrowth was quantified and representative images captured at Day 10. Scale bar, 200 μm. (E) PC9-shGATA6/shHOPX(b) cells were transfected with a control siRNA (siCon) or siRNAs against KRT6A and KRT6B. At 48 hours post-transfection, cells were subjected to an invasion assay. (F) Invasion assay was performed using indicated ADC lines with the indicated shRNAs/siRNAs. All bar charts represent the mean ± SEM. p-values calculated by Student's t-test. See also Figure S8.

Comment in

References

    1. Alam N, Gustafson KS, Ladanyi M, Zakowski MF, Kapoor A, Truskinovsky AM, Dudek AZ. Small-cell carcinoma with an epidermal growth factor receptor mutation in a never-smoker with gefitinib-responsive adenocarcinoma of the lung. Clin Lung Cancer. 2010;11:E1–4. - PubMed
    1. Ballard PL, Lee JW, Fang X, Chapin C, Allen L, Segal MR, Fischer H, Illek B, Gonzales LW, Kolla V, Matthay MA. Regulated gene expression in cultured type II cells of adult human lung. Am J Physiol Lung Cell Mol Physiol. 2010;299:L36–50. - PMC - PubMed
    1. Barletta JA, Perner S, Iafrate AJ, Yeap BY, Weir BA, Johnson LA, Johnson BE, Meyerson M, Rubin MA, Travis WD, et al. Clinical significance of TTF-1 protein expression and TTF-1 gene amplification in lung adenocarcinoma. J Cell Mol Med. 2009;13:1977–1986. - PMC - PubMed
    1. Belaguli NS, Aftab M, Rigi M, Zhang M, Albo D, Berger DH. GATA6 promotes colon cancer cell invasion by regulating urokinase plasminogen activator gene expression. Neoplasia. 2010;12:856–865. - PMC - PubMed
    1. Ben-Porath I, Thomson MW, Carey VJ, Ge R, Bell GW, Regev A, Weinberg RA. An embryonic stem cell-like gene expression signature in poorly differentiated aggressive human tumors. Nat Genet. 2008;40:499–507. - PMC - PubMed

Publication types

MeSH terms

Associated data