. 2013 Jul;9(7):416-21.
doi: 10.1038/nchembio.1259. Epub 2013 May 26.

A pan-specific antibody for direct detection of protein histidine phosphorylation

Affiliations

A pan-specific antibody for direct detection of protein histidine phosphorylation

Jung-Min Kee et al. Nat Chem Biol. 2013 Jul.

Abstract

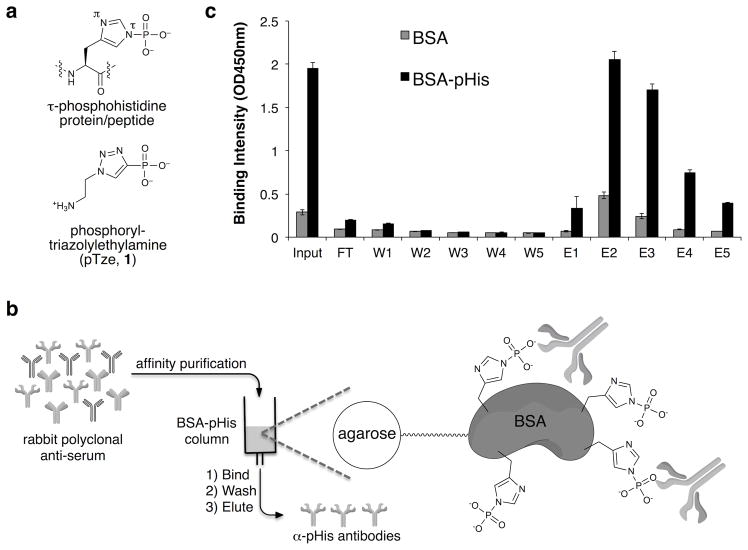
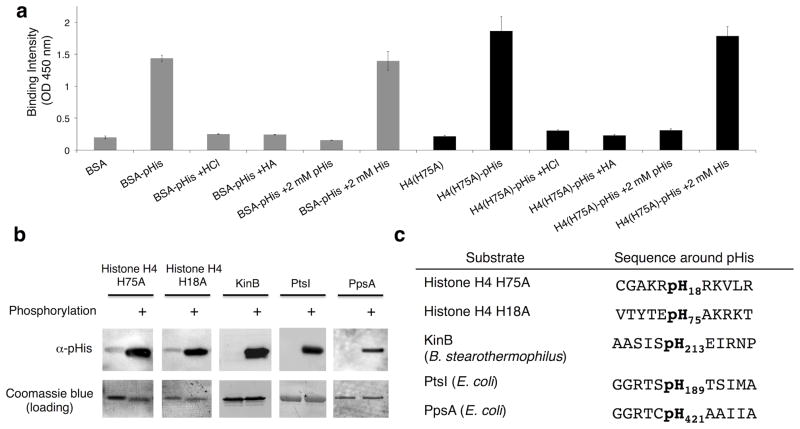
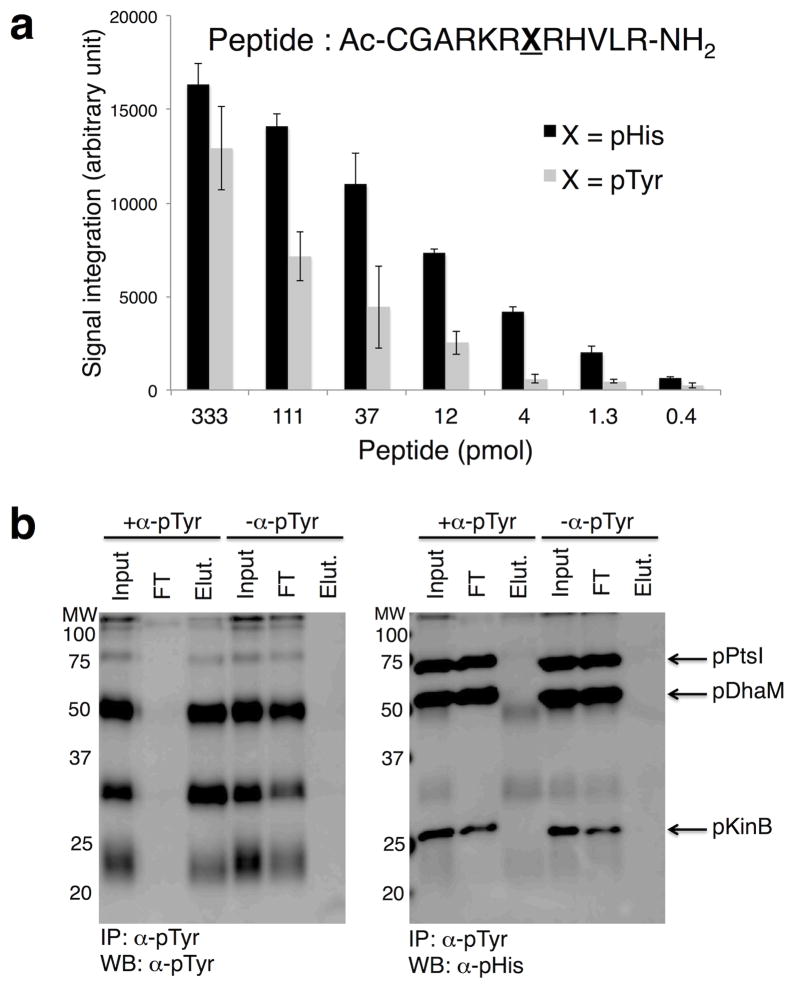
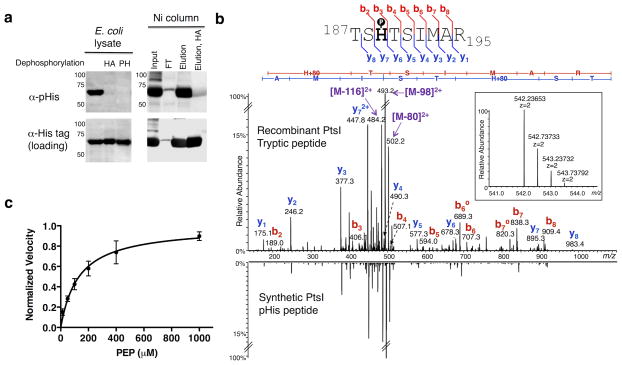
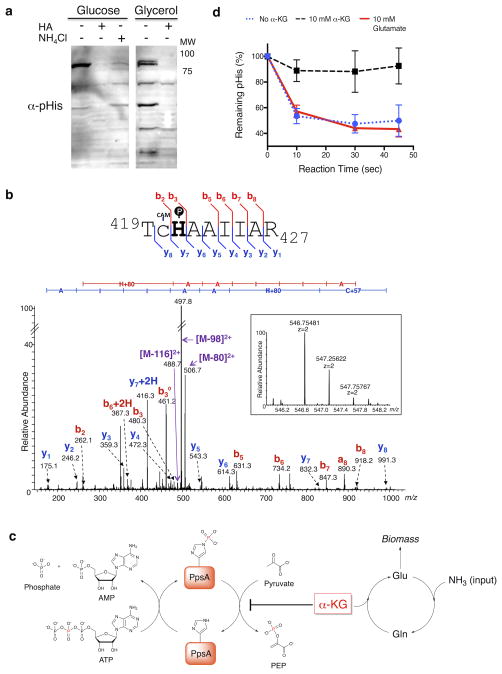
Despite its importance in central metabolism and bacterial cell signaling, protein histidine phosphorylation has remained elusive with respect to its extent and functional roles in biological systems because of the lack of adequate research tools. We report the development of the first pan-phosphohistidine (pHis) antibody using a stable pHis mimetic as the hapten. This antibody was successfully used in ELISA, western blotting, dot blot assays and immunoprecipitation and in detection and identification of histidine-phosphorylated proteins from native cell lysates when coupled with MS analysis. We also observed that the amount of protein pHis in Escherichia coli lysates depends on carbon source and nitrogen availability in the growth medium. In particular, we found that the amount of pHis on phosphoenolpyruvate synthase (PpsA) is sensitive to nitrogen availability in vivo and that α-ketoglutarate inhibits phosphotransfer from phosphorylated PpsA to pyruvate. We expect this antibody to open opportunities for investigating other pHis proteins and their functions.


Conflict of interest statement

COMPETING FINANCIAL INTERESTS

J.-M.K. and T.W.M. are co-inventors of a patent application on stable phosphohistidine analogs.

Figures

Figure 1
Figure 1. Affinity purification of antibodies raised against pTze
a) Structures of τ-pHis and its stabile mimic, pTze (1). b) Schematic depicting the strategy to affinity purify pHis polyclonal antibody. c) ELISA analysis of input, flow through (FT), wash fractions (W1, W2, W3, W4, W5), and elution fractions (E1, E2, E3, E4, E5) from the affinity purification for pHis binding affinity. Fractions E2 and E3 displayed the highest affinity for BSA-pHis compared to the BSA control (n = 4, mean ± s.d.).
Figure 2
Figure 2. Affinity purified antibodies raised against pTze are cross-reactive to phosphohistidine residues and are sequence independent
a) ELISA data of affinity-purified antibodies measured against BSA-pHis (gray bars) and histone H4(H75A)-pHis (H4(H75A)-pHis) (black bars), as well as the indicated controls (n = 4, mean ± s.d.). b) Western blots of pHis-containing proteins phosphorylated in vitro. The Coomassie Blue stain was included as the loading control. See Supplementary Fig. 18 for full Western blots. c) Sequences of pHis proteins recognized by the anti-pHis antibody (α-pHis) in panel b.
Figure 3
Figure 3. Cross-reactivity of pHis antibody to pTyr
a) Dot blot analysis of pHis and pTyr peptides derived from histone H4 sequence. The signal intensities are quantified using ImageJ program and plotted against the peptide amount (n = 3, mean ± s.d.). b) Western blot analysis of proteins immunoprecipitated with a monoclonal pTyr antibody. Proteins modified with pTyr (pTyr MW markers, Calbiochem) were mixed with pHis-containing KinB (pKinB), DhaM (pDhaM), and PtsI (pPtsI). In the left panel, pTyr proteins were successfully immunoprecipitated with α-pTyr (+α-pTyr) but not in the mock IP control (−α-pTyr). pHis proteins (pKinB, pDhaM, pPtsI) were not immunoprecipitated by α-pTyr and were found only in the flow through (FT) (right panel). Input refers to the sample prior to immunoprecipitation, FT is the supernatant after immunoprecipitation, Elut is the elution sample. See Supplementary Fig. 19 for full Western blot and Coomassie Blue stain of membranes.
Figure 4
Figure 4. Analysis of histidine phosphorylation on PtsI
a) Western blots of E. coli lysates expressing His6-tagged PtsI. Left: α-pHis blot of crude lysates and those treated with hydroxylamine (HA) or phosphohistidine phosphatase (PH). Right: Crude lysates were purified over Ni-NTA beads and the indicated fractions probed with the α-pHis antibody. As loading controls, the membranes were stripped and re-blotted with an α-His-tag antibody. See Supplementary Fig. 20 for full Western blots. b) Overexpressed PtsI was digested with trypsin and analyzed by high-resolution nano-UPLC-MS. Shown is the MS/MS spectrum from the tryptic peptide ion bearing pHis at the canonical His-189 site, with the matched b- and y- ions indicated in the spectrum and in the sequence flag diagram above (inset: MS spectrum of the precursor ion species, including its accurate mass measurement). For comparison, the MS/MS spectrum of a synthetic version of the pHis-bearing peptide is shown in mirror image below. c) A dot blot assay was developed to measure the kinetics of autophosphorylation of PtsI by PEP. A plot of the reaction velocity as a function of PEP concentration was used to determine an apparent Km value of 135 ± 30 μM (n = 3, mean ± s.d.).
Figure 5
Figure 5. pHis levels in PpsA are sensitive to nitrogen availability and are regulated by α-KG
a) Western blotting of NCM 3722 cells grown on minimal media containing glucose or glycerol as the carbon source and arginine as the nitrogen source. α-pHis signals were sensitive to hydroxylamine (HA) treatment of the lysates and nitrogen upshift in the growth media (NH4Cl). As a loading control, the membranes were imaged with colloidal gold stain (Supplementary Fig. 21). See Supplementary Fig. 22 for full Western blot. b) MS/MS of an endogenous PpsA tryptic pHis peptide identified from fractionated glucose-fed E. coli lysate (Supplementary Fig. 16). The gel band at 85 kDa was analyzed by high-resolution nano-UPLC-MS after trypsin digestion. The spectrum indicates pHis at the canonical His421 site, with the matched b- and y- ions indicated in the spectrum and in the sequence flag diagram above (CAM = S-carboxyamidomethyl) (inset: MS spectrum of the precursor ion species, including its accurate mass measurement). c) Model for regulation of PpsA catalytic cycle. Intracellular levels of α-KG can be significantly increased by nitrogen limitation. Inhibition of the PpsA dephosphorylation by the increased α-KG will lead to the buildup of phosphorylated enzyme. d) Dephosphorylation assay of autophosphorylated PpsA. The dephosphorylation was inhibited by α-KG, but not by glutamate (n = 3, mean ± s.d.).

Comment in

References

    1. Walsh CT. posttranslational modification of proteins: expanding nature’s inventory. Roberts and Company Publishers; Greenwood Village: 2006. Protein phosphorylation by protein kinases; pp. 35–80.
    1. Grimsrud PA, Swaney DL, Wenger CD, Beauchene NA, Coon JJ. Phosphoproteomics for the masses. ACS Chem Biol. 2010;5:105–119. - PMC - PubMed
    1. Kee JM, Muir TW. Chasing Phosphohistidine, an elusive sibling in the phosphoamino acid family. ACS Chem Biol. 2012;7:44–51. - PMC - PubMed
    1. Matthews HR. Protein kinases and phosphatases that act on histidine, lysine, or arginine residues in eukaryotic proteins: a possible regulator of the mitogen-activated protein kinase cascade. Pharmacol Therapeut. 1995;67:323–350. - PubMed
    1. Attwood PV, Besant PG, Piggott MJ. Focus on phosphoaspartate and phosphoglutamate. Amino Acids. 2010;40:1035–1051. - PubMed

Publication types

MeSH terms