. 2013 Jul;45(7):767-75.
doi: 10.1038/ng.2644. Epub 2013 May 26.

Combined sequence-based and genetic mapping analysis of complex traits in outbred rats

Collaborators, Affiliations

Combined sequence-based and genetic mapping analysis of complex traits in outbred rats

Rat Genome Sequencing and Mapping Consortium et al. Nat Genet. 2013 Jul.

Abstract

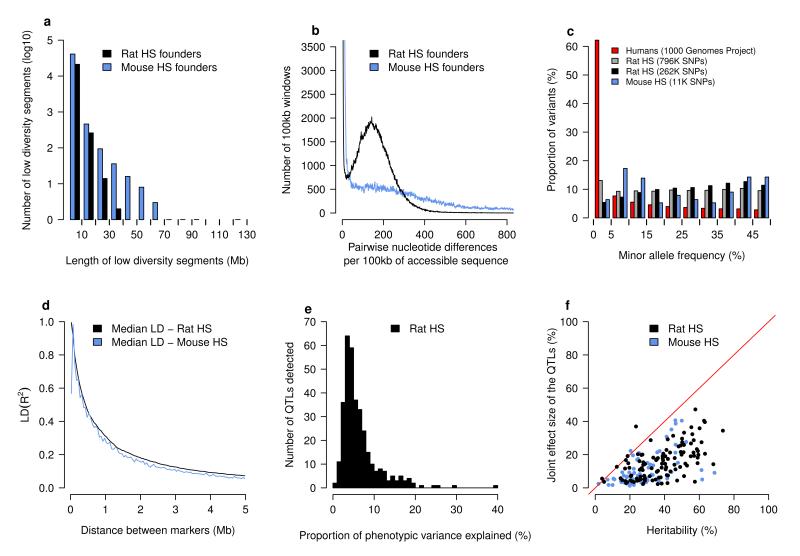
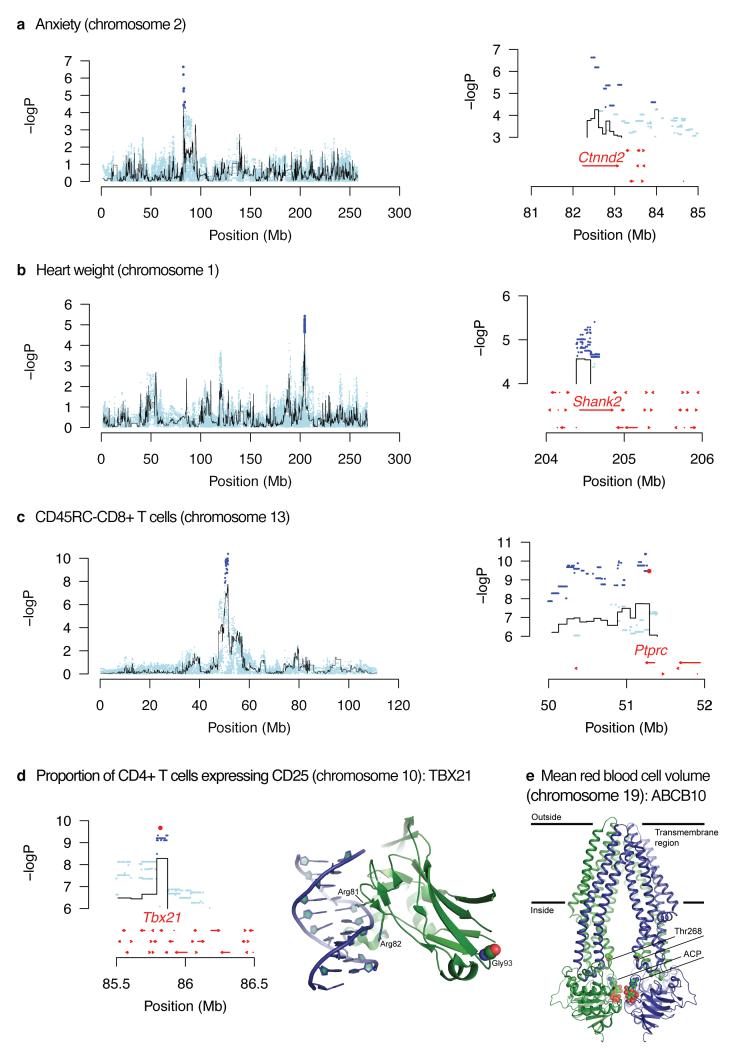
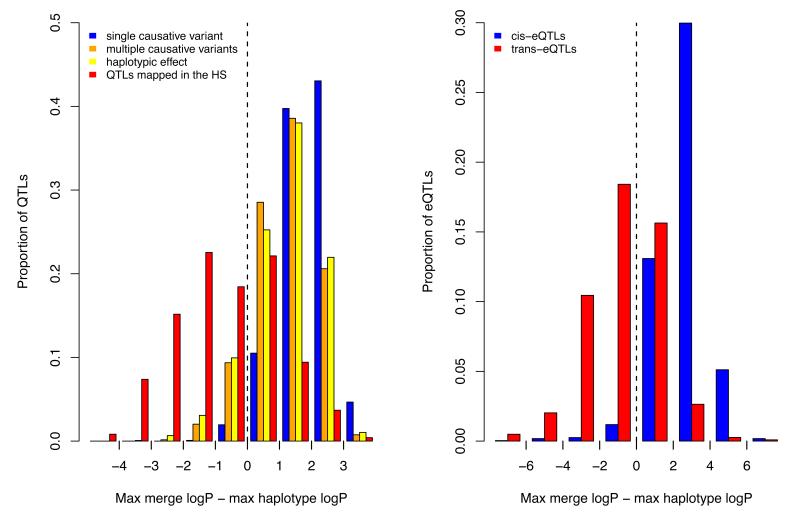
Genetic mapping on fully sequenced individuals is transforming understanding of the relationship between molecular variation and variation in complex traits. Here we report a combined sequence and genetic mapping analysis in outbred rats that maps 355 quantitative trait loci for 122 phenotypes. We identify 35 causal genes involved in 31 phenotypes, implicating new genes in models of anxiety, heart disease and multiple sclerosis. The relationship between sequence and genetic variation is unexpectedly complex: at approximately 40% of quantitative trait loci, a single sequence variant cannot account for the phenotypic effect. Using comparable sequence and mapping data from mice, we show that the extent and spatial pattern of variation in inbred rats differ substantially from those of inbred mice and that the genetic variants in orthologous genes rarely contribute to the same phenotype in both species.


Figures

Figure 1
Figure 1. Sequence diversity among progenitor strains and genetic architecture of the rat NIH-HS
a) Regions of low diversity in the rat (black) and mouse (blue) progenitors. The horizontal axis shows the length in megabases of genomic regions with little sequence divergence (less than 13 SNPs/100kb). The vertical axis shows the numbers of segments observed in the eight progenitors. b) Sequence divergence in the progenitors. The horizontal axis is a measure of pairwise sequence diversity, the number of sequence differences observed in windows of 100 kilobases, the vertical axis gives the number of observations. The horizontal axis is truncated at 800 sequence differences and the vertical axis at 3500 windows. c) Minor allele frequencies in rat (gray & black), mouse (blue) and human (red) populations. The rat analysis was performed with the set of autosomal markers used to reconstruct haplotypes (261,684) as well as the complete set of 796,187 autosomal variants on the RATDIV array. d) The extent of linkage disequilibrium (measured as R2) in the rat NIH-HS. Distances between pairs of autosomal markers were binned (horizontal axis). The vertical axis shows the median of the corresponding distribution of LD. e) The distribution of effect sizes for the 343 loci mapped by mixed models in the rat NIH-HS. The horizontal axis is the proportion of phenotypic variance attributable to each locus. f) The proportion of heritability that can be explained by the joint effect of the QTLs detected for each phenotype. Each dot represents a single phenotype, with the horizontal axis showing the heritability and the vertical axis the joint QTL effect for that phenotype.
Figure 2
Figure 2. Genome scan for platelet aggregation
The scan shows the results of a haplotype mixed model. The vertical scale is the negative logarithm of the P-value (logP) for association with variation in platelet aggregation. The peak on chromosome 4 harbors the von Willebrand factor gene that is identified through sequence analysis as the causative gene.
Figure 3
Figure 3. Merge analysis to identify causative genes and sequence variants
The top three panels (a – c) show, on the left, the scans for a whole chromosome, with the name of the phenotype. The black lines represent the haplotype analysis and the blue dots are the merge analysis results of testing for association with all sequence variants identified in the progenitor strains. On the right is an enlargement of the highest peak showing the location of candidate variants and genes. Candidate variants are those whose significance exceeds that of the haplotype analysis (i.e. blue dots are above the highest value of the black line). Genes are shown by red arrows. Panel (d) shows candidate variants on chromosome 10 for the proportion of CD4+ cells with high expression of CD25. The highest variant lies within the TBX21 protein. The crystal structure of human TBX5-DNA complex (PDB code 2X6V) maps the location of the rat TBX21 mutation Gly175Arg to the DNA binding domain. The structure of TBX5 (green) complexed with DNA (blue) is shown in ribbon representation. Gly93 is shown as spheres (C atoms in green, O atoms in red N atoms in blue). Gly93 and corresponding Gly175 (rat) are conserved. Side chains of two arginines that mediate interactions with DNA are shown as sticks. Panel (e) shows a candidate variant in the Abcb10 gene on chromosome 19 for a locus influencing mean red cell volume. The structure of the homodimeric ABCB10 (PDB code 4AYT) is shown in ribbon representation, with the monomers in blue and green. Two ATP analogues (ACP) and side chains of Thr268 are shown as spheres (C atoms in green, O atoms in red N atoms in blue and P in orange). Thr268 in the human protein corresponds to the conserved Thr233 residue in the rat protein. The rat ABCB10 mutation Thr233Met lies in the central cavity of the translocation pathway. Amino acid sequence identity between rat and human ABCB10 is 84% (587 aligned residues).
Figure 4
Figure 4. Merge analysis and simulations
The figure plots the difference between the negative logarithm p-value of association (logP) of imputed variants and haplotype-based logP for the rat QTLs (4a) and a set of 1,386 cis-acting and 7,464 trans-acting expression QTLs mapped in a mouse HS (4b). In cases where there is a single causal variant at a QTL, the logP of some imputed variants will exceed that of the haplotypes, so that the mean of the distribution of the difference between these two logP values will be greater than zero. This is shown as a blue histogram on the plot 4a. The distribution observed for the phenotypic QTLs, shown in red in 4a, has a mean less than zero. The results of simulating haplotypic effects are shown in yellow, and in orange the consequence of simulating multiple causative variants. The distribution of the difference in logP for the cis-eQTLs is shown in blue in 4b to highlight the resemblance with the results of simulating single causative variants. The distribution for the trans-eQTLs is shown in green in 4b and is most similar to that for the phenotypic QTLs.

Similar articles

Cited by

References

    1. Donnelly P. Progress and challenges in genome-wide association studies in humans. Nature. 2008;456:728–31. - PubMed
    1. Flint J, Mackay TF. Genetic architecture of quantitative traits in mice, flies, and humans. Genome Res. 2009;19:723–33. - PMC - PubMed
    1. Hansen C, Spuhler K. Development of the National Institues of Health genetically heterogeneous rat stock. Alcoholism, Clinical and Experimental Research. 1984;8:477–479. - PubMed
    1. Keane TM, et al. Mouse genomic variation and its effect on phenotypes and gene regulation. Nature. 2011;477:289–94. - PMC - PubMed
    1. Talbot CJ, et al. High-resolution mapping of quantitative trait loci in outbred mice. Nature Genetics. 1999;21:305–308. - PubMed

Publication types