. 2013 Jul;14(7):756-63.
doi: 10.1038/ni.2615. Epub 2013 May 26.

The transcriptional architecture of early human hematopoiesis identifies multilevel control of lymphoid commitment

Affiliations

The transcriptional architecture of early human hematopoiesis identifies multilevel control of lymphoid commitment

Elisa Laurenti et al. Nat Immunol. 2013 Jul.

Abstract

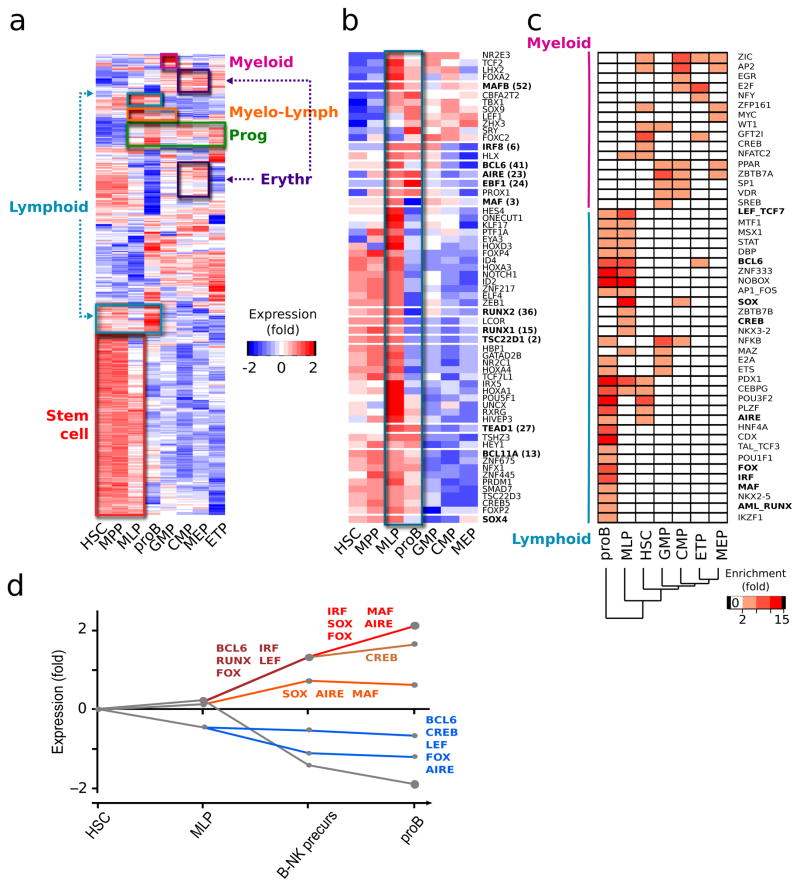
Understanding how differentiation programs originate from the gene-expression 'landscape' of hematopoietic stem cells (HSCs) is crucial for the development of new clinical therapies. We mapped the transcriptional dynamics underlying the first steps of commitment by tracking transcriptome changes in human HSCs and eight early progenitor populations. We found that transcriptional programs were extensively shared, extended across lineage-potential boundaries and were not strictly lineage affiliated. Elements of stem, lymphoid and myeloid programs were retained in multilymphoid progenitors (MLPs), which reflected a hybrid transcriptional state. By functional single cell analysis, we found that the transcription factors Bcl-11A, Sox4 and TEAD1 (TEF1) governed transcriptional networks in MLPs, which led to B cell specification. Overall, we found that integrated transcriptome approaches can be used to identify previously unknown regulators of multipotency and show additional complexity in lymphoid commitment.


Figures

Fig. 1
Fig. 1. Transcriptional architecture of the first steps of the human hematopoietic hierarchy
(a) Differential expression distances overlaid on the current hierarchical model of human hematopoietic differentiation. Solid arrows represent accepted progenitor-product relationships while dashed arrows represent assumed ones. The number of genes upregulated in the precursor population is shown in bold and red and those upregulated in the product population in brown. Populations shown in orange were used for undirected pattern discovery detailed in Fig. 2. Differential expression was calculated using limma (fold change >2 and FDR<0.05) comparing the downstream population to its progenitor. (b) Principal Component Analysis of the 10 human hematopoietic stem and early progenitor cells. Only the first 2 principal components are shown here as they explain the vast majority of the variation in our dataset (Supplementary Figure 1a). All populations were purified from 3 to 5 independent pools of cord blood (CB) with the exception of ETP, which were isolated from 3 independent neonatal thymi. All analyses were performed on the DREGH genes.
Fig. 2
Fig. 2. Six predominant transcriptional programs are associated with commitment of human HSC
(a, b) Heat-maps of the 14 significant gene expression profiles as derived by the STEM algorithm (a) and K-means clustering method (b) (performed specifying 14 clusters, for other values of k, see (c). Each box in the heat-map represents the mean of the expression of all the genes assigned to that profile in the indicated populations. Log transformed expression data is mean centered and hierarchically clustered by profiles. Color-coded boxes on the right of each heat-map represent the classification of each profile into a transcriptional program based on the populations in which the expression of the genes in that transcriptional program is highest. (c) Quantitative comparison of the two pattern recognition methods. The percentage of DREGH genes assigned to each transcriptional program according to the two algorithms is shown. The k-means algorithm was run independently with 3 different values of k (8, 14 and 18) chosen after applying the adjusted Figures of Merit method (FOM, Supplementary Figure 2a) to determine at which k the algorithm reaches its maximum predictive value. p = 0.89 by a two-sample Kolmogorov-Smirnov test between STEM method and k-means with k=14. An overlay of the transcriptional programs on the current model of hematopoietic differentiation is presented in Supplementary Figure 2b.
Fig. 3
Fig. 3. Transcription factor expression complexity during commitment
(a) Heat-map of the expression of the 477 transcription factors differentially expressed between any 2 hematopoietic populations. Boxes highlight the transcription factors belonging to the 6 main transcriptional programs defined in Fig. 2 and Supplementary Figure 2b. (b) Heat-map of the expression of the 60 transcription factors with an early lymphoid pattern. Blue box: transcription factors expression in MLP and proB. Bold: transcription factors highlighted selected for functional validation. In both a and b, log transformed expression data is mean centered and hierarchically clustered by gene. (c) Transcription factor families whose DNA-binding motifs were found over-represented in the promoters of at least one population-specific gene set (peach to red boxes). Bold: transcription factor families of which at least one member was found among the 60 early-lymphoid specific transcription factors as defined by their expression. The gene lists used for this analysis are listed in Supplementary Table 7. (d) Dynamic regulatory map of transcription factors controlling specification to B cells generated with the DREM algorithm. y axis: log transformed expression relative to first developmental stage, HSC ; x-axis: stepwise progression along B cell commitment. Indicated here are the transcription factor families predicted to be stage-specific regulators of expression that were also found in b and c (complete output in Supplementary Figure 2). The lines represent the average expression of a group of genes and the size of the circles its standard deviation.
Fig. 4
Fig. 4. Single cell shRNA silencing screen for transcription factors that determine MLP commitment to the lymphoid fate
(a) and (b) Proportion of myeloid (CD11b+, top), lymphoid (CD19+, middle) and NK (CD56+, bottom) colonies generated from single MLP in which the indicated transcription factors were silenced. The proportions for each shRNA are normalized to single MLP from the same pool of CB transduced with control hairpins lentiviral vectors (shLacZ and-or shLUC). shBCL11A, shIRF8, shMAF, shRUNX2, shTSC22D1 and shLacZ expression are driven from the H1 promoter, while shBCL6, shEBF1, shGATA2, shSOX4, shTEAD1 and shLUC are downstream of the U6 promoter. n=3 distinct pools of CB for shBCL11A-1, shBCL6, shEBF1, n=4 for others. Non-normalized data is available in Supplementary Table 8. (c) Percentage of myeloid colonies (CD11b+) that are fully differentiated to monocytes (>95% CD14+). Dashed lines connect measurements from the same CB pool. (d) Percentage of GFP+ CD34+ CD133+ in S-G2-M after 100 MLP per well were cultured 7 days on MS5 stroma in the same conditions as for the screen described above. n≥3. (e) Methylcellulose assays from 800 GFP+ CD34+ cell sorted 3 days after transduction of Lin- CB with the indicated shRNA-expressing lentiviral vectors. Shown is the number of erythroid (top) and myeloid (bottom) colonies relative to control 12 days after plating. n≥3. For all panels: mean and SEM is shown; *: p<0.1; **:p<0.05 by paired two-tailed t-test.
Fig. 5
Fig. 5. Effects of BCL11A, BCL6, SOX4 or TEAD1 silencing on B cell commitment in vivo
Mice were transplanted with Lin cells transduced with lentiviral vectors expressing either control shRNA or shRNAs against the candidate transcription factors that led to significant silencing in vivo. Silencing levels are shown in Supplementary Figure 5a. The composition of the human graft was analyzed 8 to 10 weeks post-transplantation. (a) Percentage of total B cells (CD19+) among human cells (CD45+ GFP+) in the injected bone. Circles represent individual animals; shLacZ, n=21; shBCL11A, n=19 (p < 0.0001); shLUC, n=23; shBCL6, n=5; shSOX4, n=12 (p < 0.0001); shTEAD1, n=14 (p = 0.0002). Raw data pertaining to this figure is available in Supplementary Table 9; results in the other bones are shown in Supplementary Figure 5b–c. (b) and (c): the quantification of each intermediate of B cell differentiation in xenografts was performed according to the flow cytometry gating strategy presented in Supplementary Figure 5d. (b) Percentage of MLP among human (GFP+) cells. shLacZ, n=4; shBCL11A, n=4; shLUC, n=18; shBCL6, n=5; shSOX4, n=12; shTEAD1, n=12. (c) Number of population doublings between the populations indicated. Population doublings were calculated as: log2 (product population/precursor population). Full quantification of each B cell progenitor population is available in Supplementary Figure 5f. Mean ± SEM is shown. *: p<0.1; **:p<0.05 by unpaired two-tailed t-test.
Fig. 6
Fig. 6. BCL11A, SOX4 or TEAD1 KD do not affect proliferation or apoptosis of B cell progenitors but decrease expression of master regulators of B cell commitment
(a) Percentage of AnnexinV+ cells in early B cells. (b) Percentage of cells in each phase of the cell cycle in early B cells. G0: Ki67 Hoechst, G: Ki67+ Hoechst, S-G2-M: Ki67+ Hoechst+. For a and b: n=4 for shLacZ, n=11 for shLUC, n=3 for H1shBCL11A, n=6 for U6shSOX4 and n=4 for shTEAD1. Similar measurements for proB and preB populations are in Supplementary Figure 6a–b. (c) mRNA expression levels of IKZF1, E2A, EBF1 and PAX5 in Early B cells. All values were normalized to 2 housekeeping genes (GAPDH and ACTB) and are shown here relative to control. Ctrl, n=12; shBCL11A, n=2; shSOX4, n=3, shTEAD1, n=4. All measurements are from the injected femur of NSG mice 8 to 10 weeks after transplantation. Mean and SEM is shown. *: p<0.1; **:p<0.05 by unpaired two-tailed t-test.

References

    1. Orkin SH, Zon LI. Hematopoiesis: An Evolving Paradigm for Stem Cell Biology. Cell. 2008;132:631–644. - PMC - PubMed
    1. Enver T, Pera M, Peterson C, Andrews PW. Stem Cell States, Fates, and the Rules of Attraction. Cell Stem Cell. 2009;4:387–397. - PubMed
    1. Zandi S, Bryder D, Sigvardsson M. Load and lock: the molecular mechanisms of B-lymphocyte commitment. Immunol Rev. 2010;238:47–62. - PubMed
    1. Nutt SL, Kee BL. The transcriptional regulation of B cell lineage commitment. Immunity. 2007;26:715–725. - PubMed
    1. Georgopoulos K. Haematopoietic cell-fate decisions, chromatin regulation and ikaros. Nat Rev Immunol. 2002;2:162–174. - PubMed

Publication types

Associated data

Grants and funding