. 2013 May 21;104(10):2264-72.
doi: 10.1016/j.bpj.2013.03.061.

DNA ejection from an archaeal virus--a single-molecule approach

Affiliations

DNA ejection from an archaeal virus--a single-molecule approach

K J Hanhijärvi et al. Biophys J. .

Abstract

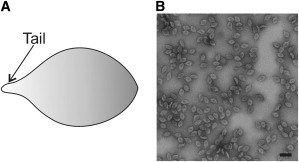
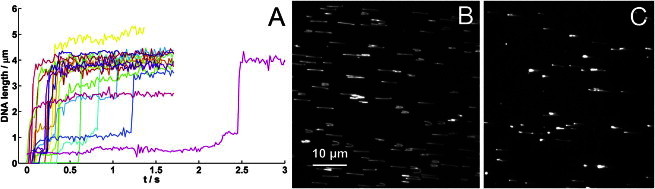
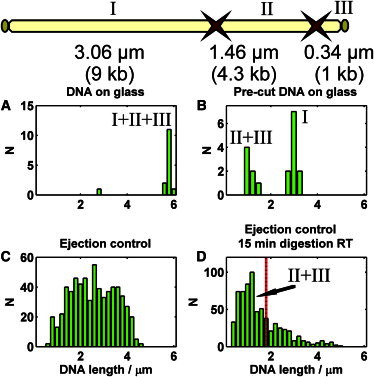
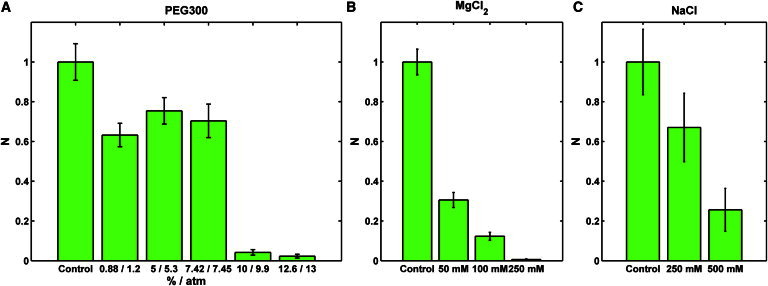
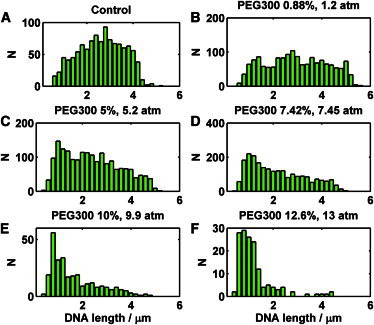
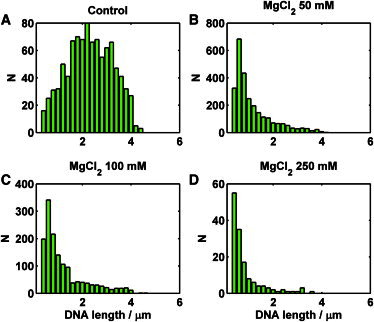
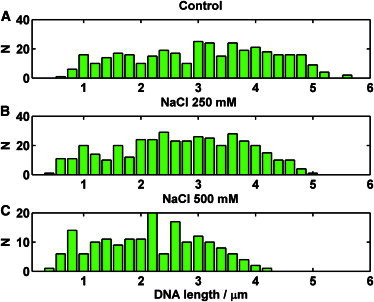
The translocation of genetic material from the viral capsid to the cell is an essential part of the viral infection process. Whether the energetics of this process is driven by the energy stored within the confined nucleic acid or cellular processes pull the genome into the cell has been the subject of discussion. However, in vitro studies of genome ejection have been limited to a few head-tailed bacteriophages with a double-stranded DNA genome. Here we describe a DNA release system that operates in an archaeal virus. This virus infects an archaeon Haloarcula hispanica that was isolated from a hypersaline environment. The DNA-ejection velocity of His1, determined by single-molecule experiments, is comparable to that of bacterial viruses. We found that the ejection process is modulated by the external osmotic pressure (polyethylene glycol (PEG)) and by increased ion (Mg(2+) and Na(+)) concentration. The observed ejection was unidirectional, randomly paused, and incomplete, which suggests that cellular processes are required to complete the DNA transfer.


Figures

Figure 1
Figure 1
Spindle-shaped virus His1. (A) Schematic presentation of the virus particle. (B) Electron micrograph of negatively stained His1 particles. Scale bar: 100 nm.
Figure 2
Figure 2
(A) Single DNA ejection events recorded at 58 fps. Linear fits to the steepest parts of the curves yield an average ejection velocity of 48.97 ± 24.48 μm/s (144 ± 72 kbp/s). (B and C) Primary fluorescence data represent purified His1 DNA nonspecifically attached to a cleaned coverslip by terminal proteins stretched out in the flow (B) and His1 DNA ejected from the virus attached to a cleaned coverslip stretched out in the flow (C).
Figure 3
Figure 3
DNA length histograms for the cleavage experiment. Top: Schematic of DraI restriction sites of the His1 genome. The genome is divided into fragments I (9 kb), II (4.3 kb), and III (1 kb). (A) Undigested purified His1 genome. (B) DraI-digested purified His1 genome; the sample consists of ∼1.5 μm and ∼3 μm fragments, corresponding to 5.3 kb (II+III) and 9 kb (I), respectively. (C) Length distribution of DNA ejected from His1 particles. (D) Length distribution of DNA ejected from His1 particles and digested with DraI. Mostly short fragments of ∼1 μm are observed. Vertical line corresponds to a 5.3-kb-long fragment (II+III).
Figure 4
Figure 4
(A–C) Normalized average number of ejections per field of view in the presence of (A) PEG300 (the corresponding osmotic pressure was calculated from PEG300 concentration as described previously (38)), (B) magnesium chloride (the control sample was prepared in 10-fold diluted His1 buffer containing 3.5 mM MgCl2), and (C) sodium chloride (the control sample was prepared in 10-fold diluted His1 buffer containing 50 mM NaCl). Error bars represent 1 SD.
Figure 5
Figure 5
Ejected DNA length histograms in varying concentrations of PEG300. All experiments were done in 10-fold diluted His1 buffer. (A) The control experiment contained no PEG300. (B) Experiment with 0.88% PEG300 corresponding to 1.2 atm. (C) Experiment with 5% PEG300 corresponding to 5.2 atm. (D) Experiment with 7.42% PEG300 corresponding to 7.45 atm. (E) Experiment with 10% PEG300 corresponding to 9.9 atm. (F) Experiment with 12.6% PEG300 corresponding to 13 atm.
Figure 6
Figure 6
Histograms of DNA lengths ejected in the presence of magnesium chloride. (A) The control experiment was done in 10-fold diluted His1 buffer containing 3.5 mM MgCl2. (B) Modified 10-fold diluted His1 buffer containing 50 mM MgCl2. (C) Modified 10-fold diluted His1 buffer containing 100 mM MgCl2. (D) Modified 10-fold diluted His1 buffer containing 250 mM MgCl2.
Figure 7
Figure 7
Ejected DNA length histograms in the presence of sodium chloride. (A) The control experiment was done in 10-fold diluted His1 buffer containing 50 mM NaCl. (B) Modified 10-fold diluted His1 buffer containing 250 mM NaCl. (C) Modified 10-fold diluted His1 buffer containing 500 mM NaCl.

Comment in

References

    1. Suttle C.A. Marine viruses—major players in the global ecosystem. Nat. Rev. Microbiol. 2007;5:801–812. - PubMed
    1. Yang X., Yang H., Zhao G.P. Infectious disease in the genomic era. Annu. Rev. Genomics Hum. Genet. 2008;9:21–48. - PubMed
    1. Pina M., Bize A., Prangishvili D. The archeoviruses. FEMS Microbiol. Rev. 2011;35:1035–1054. - PubMed
    1. Atanasova N.S., Roine E., Oksanen H.M. Global network of specific virus-host interactions in hypersaline environments. Environ. Microbiol. 2012;14:426–440. - PubMed
    1. Bize A., Karlsson E.A., Prangishvili D. A unique virus release mechanism in the Archaea. Proc. Natl. Acad. Sci. USA. 2009;106:11306–11311. - PMC - PubMed

Publication types

LinkOut - more resources