Pin1-Nanog expression in human glioma is correlated with advanced tumor progression
- PMID: 23708493
- PMCID: PMC3776722
- DOI: 10.3892/or.2013.2481
Pin1-Nanog expression in human glioma is correlated with advanced tumor progression
Abstract
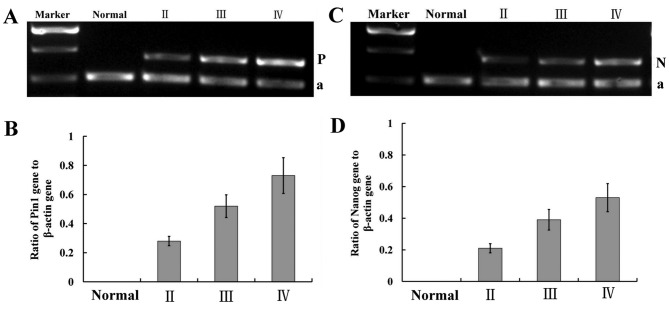
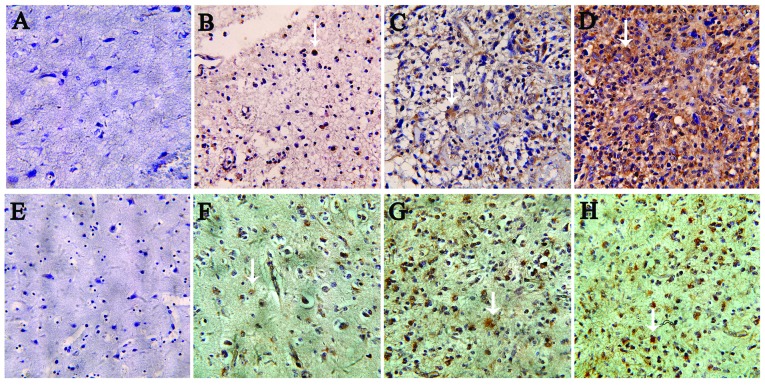
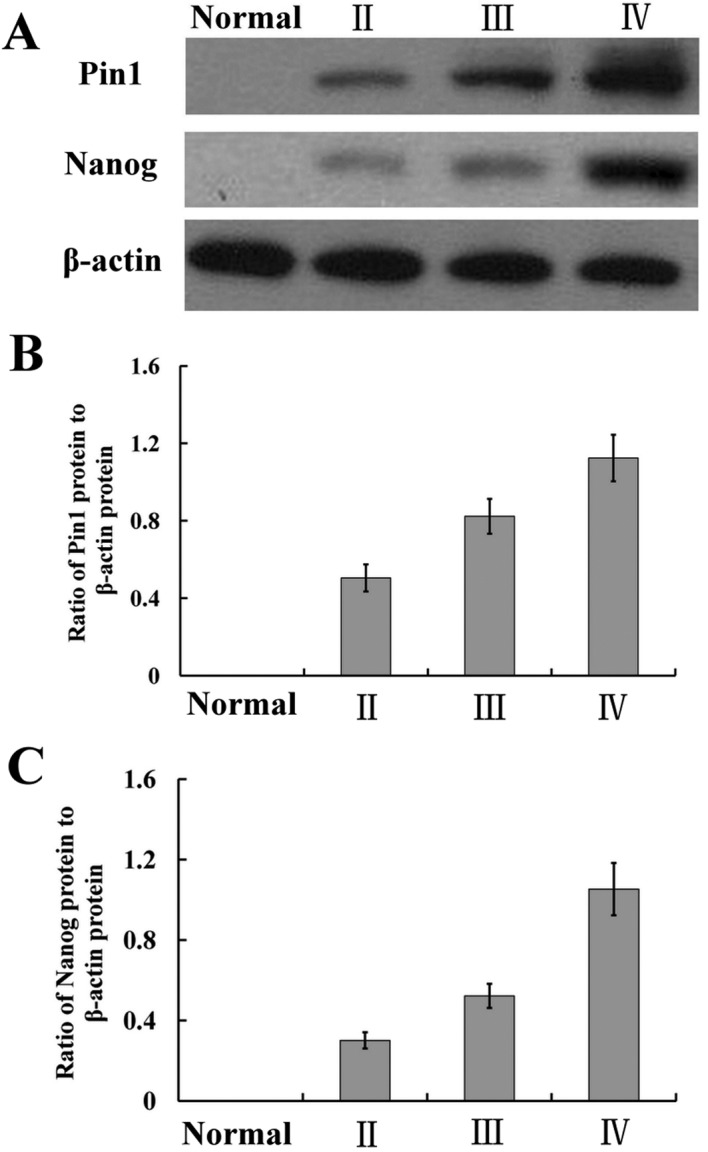
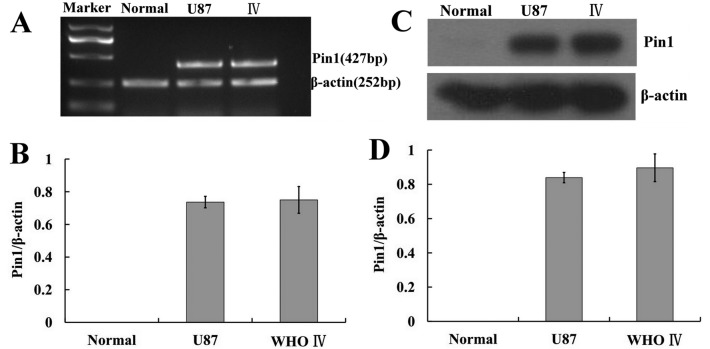
The stemness gene Nanog has been shown to play an important role in tumor development, including glioma. Nanog is phosphorylated at multiple Ser/Thr-Pro motifs, which promotes the interaction between Nanog and the prolyl isomerase Pin1, leading to Nanog stabilization by suppressing its ubiquitination. The present study investigated the expression and relationship of Pin1 and Nanog in human gliomas. Significantly higher mRNA and protein expression levels of Pin1 and Nanog were demonstrated in 120 glioma specimens of different pathological grades by RT-PCR, immunohistochemistry staining and western blot analysis. The relative levels of Pin1 expression, as well as Nanog expression, were significantly positively correlated with pathological grade. Moreover, a positive correlation of Pin1 and Nanog expression in human gliomas was noted. Co-localization of Pin1 and Nanog was observed in the perinuclear space in the cytoplasm of glioma cells detected by immunofluorescence staining. Significantly positive correlation between Pin1 and Nanog in gliomas indicated that Pin1 and Nanog may be related to tumorigenesis and development of glioma cells.
Figures

Similar articles
-
Phosphorylation stabilizes Nanog by promoting its interaction with Pin1.Proc Natl Acad Sci U S A. 2010 Jul 27;107(30):13312-7. doi: 10.1073/pnas.1005847107. Epub 2010 Jul 9. Proc Natl Acad Sci U S A. 2010. PMID: 20622153 Free PMC article.
-
Expression of NANOG in human gliomas and its relationship with undifferentiated glioma cells.Oncol Rep. 2011 Sep;26(3):593-601. doi: 10.3892/or.2011.1308. Epub 2011 May 13. Oncol Rep. 2011. PMID: 21573506
-
[Expression and clinical significance of Pin1 and Cyclin D1 in cervical cancer cell lines and cervical epithelial tissues].Ai Zheng. 2006 Mar;25(3):367-72. Ai Zheng. 2006. PMID: 16536997 Chinese.
-
The peptidyl-prolyl isomerase Pin1.Prog Cell Cycle Res. 2003;5:477-87. Prog Cell Cycle Res. 2003. PMID: 14593743 Review.
-
Dual Roles of Pin1 in Cancer Development and Progression.Curr Pharm Des. 2017 Nov 16;23(29):4422-4425. doi: 10.2174/1381612823666170703164711. Curr Pharm Des. 2017. PMID: 28671058 Review.
Cited by
-
SAHA and/or MG132 reverse the aggressive phenotypes of glioma cells: An in vitro and vivo study.Oncotarget. 2017 Jan 10;8(2):3156-3169. doi: 10.18632/oncotarget.13680. Oncotarget. 2017. PMID: 27911270 Free PMC article.
-
Pharmacotherapeutic potential of walnut (Juglans spp.) in age-related neurological disorders.IBRO Neurosci Rep. 2022 Nov 26;14:1-20. doi: 10.1016/j.ibneur.2022.10.015. eCollection 2023 Jun. IBRO Neurosci Rep. 2022. PMID: 36507190 Free PMC article. Review.
-
Deregulated proliferation and differentiation in brain tumors.Cell Tissue Res. 2015 Jan;359(1):225-54. doi: 10.1007/s00441-014-2046-y. Epub 2014 Nov 23. Cell Tissue Res. 2015. PMID: 25416506 Free PMC article. Review.
-
Androgen/androgen receptor axis maintains and promotes cancer cell stemness through direct activation of Nanog transcription in hepatocellular carcinoma.Oncotarget. 2016 Jun 14;7(24):36814-36828. doi: 10.18632/oncotarget.9192. Oncotarget. 2016. PMID: 27167111 Free PMC article.
-
G-protein-coupled receptor kinase-5 promotes glioblastoma progression by targeting the nuclear factor kappa B pathway.Am J Transl Res. 2018 Nov 15;10(11):3370-3384. eCollection 2018. Am J Transl Res. 2018. PMID: 30662593 Free PMC article.
References
-
- Wen PY, Kesari S. Malignant gliomas in adults. N Engl J Med. 2008;359:492–507. - PubMed
-
- Linderholm BK, Gruvberger-Saal S, Ferno M, et al. Vascular endothelial growth factor is a strong predictor of early distant recurrences in a prospective study of premenopausal women with lymph-node negative breast cancer. Breast. 2008;17:484–491. - PubMed
-
- Ezeh UI, Turek PJ, Reijo RA, et al. Human embryonic stem cell genes OCT4, NANOG, STELLAR, and GDF3 are expressed in both seminoma and breast carcinoma. Cancer. 2005;104:2255–2265. - PubMed
Publication types
MeSH terms
Substances
LinkOut - more resources
Full Text Sources
Other Literature Sources
Research Materials
Miscellaneous