. 2013 Nov 28;32(48):5471-80.
doi: 10.1038/onc.2013.175. Epub 2013 May 27.

HOX-mediated LMO2 expression in embryonic mesoderm is recapitulated in acute leukaemias

Affiliations
Free PMC article

HOX-mediated LMO2 expression in embryonic mesoderm is recapitulated in acute leukaemias

F J Calero-Nieto et al. Oncogene. .
Free PMC article

Abstract

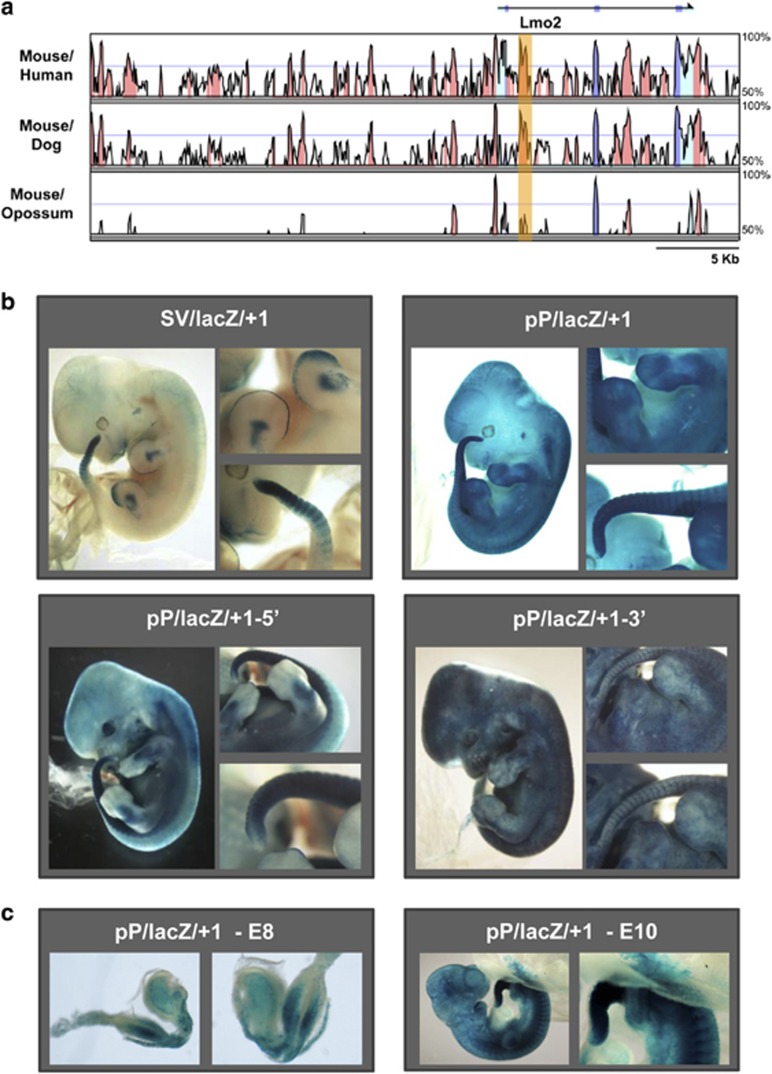
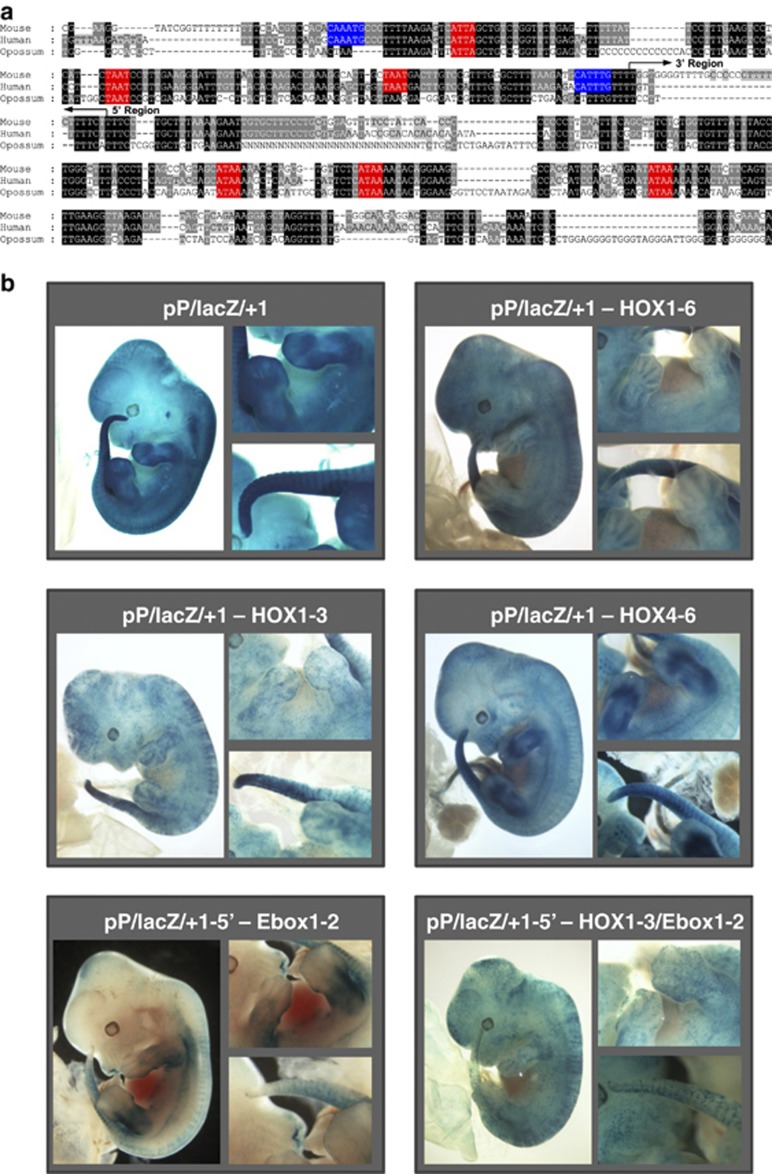
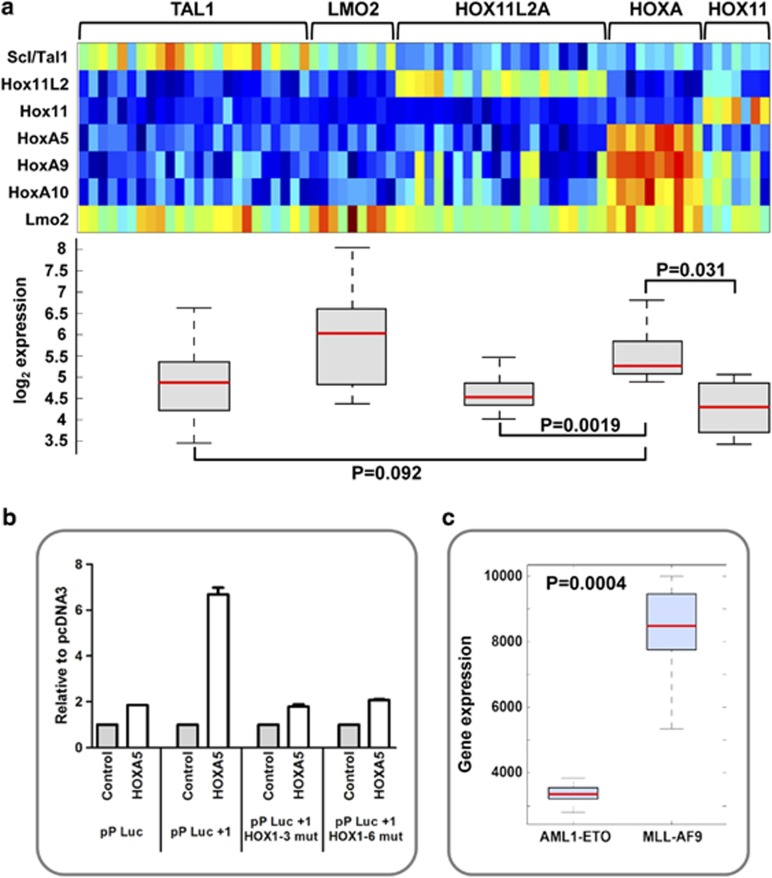
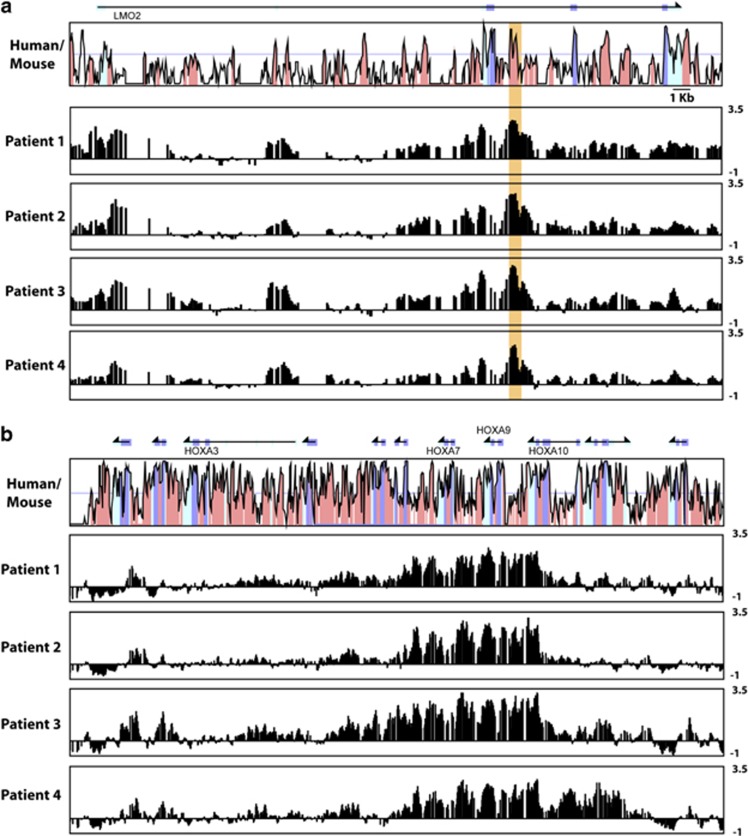
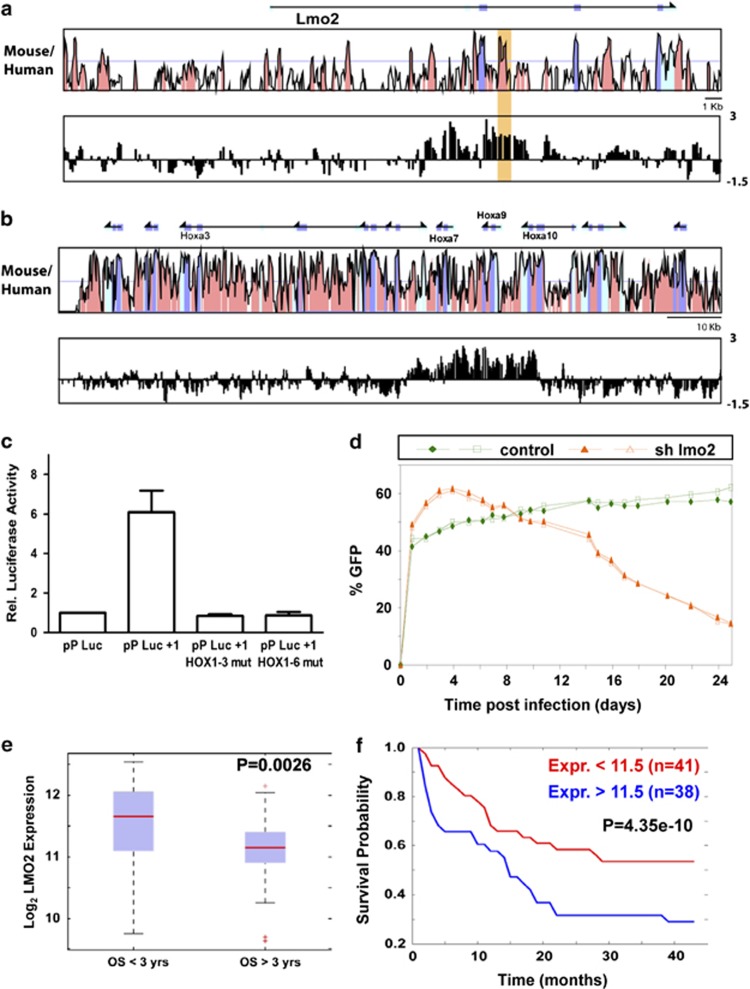
The Lim Domain Only 2 (LMO2) leukaemia oncogene encodes an LIM domain transcriptional cofactor required for early haematopoiesis. During embryogenesis, LMO2 is also expressed in developing tail and limb buds, an expression pattern we now show to be recapitulated in transgenic mice by an enhancer in LMO2 intron 4. Limb bud expression depended on a cluster of HOX binding sites, while posterior tail expression required the HOX sites and two E-boxes. Given the importance of both LMO2 and HOX genes in acute leukaemias, we further demonstrated that the regulatory hierarchy of HOX control of LMO2 is activated in leukaemia mouse models as well as in patient samples. Moreover, Lmo2 knock-down impaired the growth of leukaemic cells, and high LMO2 expression at diagnosis correlated with poor survival in cytogenetically normal AML patients. Taken together, these results establish a regulatory hierarchy of HOX control of LMO2 in normal development, which can be resurrected during leukaemia development. Redeployment of embryonic regulatory hierarchies in an aberrant context is likely to be relevant in human pathologies beyond the specific example of ectopic activation of LMO2.


Figures

Figure 1
Figure 1
The LMO2 +1 enhancer drives expression to the developing limb and tail buds as well as to endothelium in transgenic mouse embryos. (a) MVista representation of sequence conservation across the mouse Lmo2 locus showing mouse/human, mouse/dog and mouse/opossum alignments. The conservation plots show regions with at least 50% of conservation (y axis). Peaks of sequence conservation in exons are shown in blue, those in transcribed but not in translated regions (3′ UTR and 5′ UTR) are shown in pale blue and those in non-coding regions are shown in orange. Arrows indicate the direction of transcription. The region corresponding to the +1 enhancer is highlighted. (b) Whole-mount staining of representative E12.5 transgenic mouse embryos for the constructs indicated, with close-up views of limbs and tail bud regions shown to the right of each whole-mount view. LMO2 +1 enhancer directed expression of reporter gene to the PZ region, tail bud, developing limbs and endothelium with a heterologous SV40 (SV/lacZ/+1) and endogenous LMO2 proximal promoter (pP/lacZ/+1). Transgenic embryos carrying 5′ region of +1 enhancer (pP/lacZ/+1-5′) presented staining in tail bud, developing limbs and endothelium. Transgenic embryos carrying 3′ region of +1 enhancer (pP/lacZ/+1-3′) only present strong endothelial staining. (c) Representative E8.5 and E10.5 mouse embryos from a transgenic mouse line carrying the pP/lacZ/+1 construct, showing staining in the PZ, developing limbs and tail bud area.
Figure 2
Figure 2
HOX and E-box motifs are critical for limb and tail bud activity of the +1 enhancer in vivo. (a) Nucleotide sequence alignment of the +1 enhancer with conserved HOX (red) and Ebox (blue) motifs marked. Arrows indicate the boundaries of the 5′ and 3′ deletion constructs. (b) Representative transgenic mouse embryos at E12.5 showing whole-mount X-Gal reporter expression driven by wild-type and mutated +1 enhancer constructs, with close-up views of limbs and tail bud regions shown to the right of each whole-mount view. Simultaneous mutation of all six putative HOX binding sites (pP/lacZ/+1–HOX1-6) or homeoboxes located in 5′ region of +1 enhancer (pP/lacZ/+1–HOX1-3) abolished staining in developing limbs and the PZ but did not affect endothelial or tail bud staining. Staining pattern of embryos carrying mutation of homeoboxes located in 3′ region of +1 enhancer (pP/lacZ/+1–HOX4-6) was indistinguishable from wild-type enhancer. Simultaneous mutation of two E-boxes located in 5′ region of +1 enhancer (pP/lacZ/+1-5′–Ebox1-2) caused a significant reduction in tail bud staining but did not affect staining in limbs and endothelium. Simultaneous mutation of three homeoboxes and two E-boxes located in 5′ region of +1 enhancer (pP/lacZ/+1-5′–HOX1-3/Ebox1-2) with only endothelial staining remaining.
Figure 3
Figure 3
A link between HOX activation and the LMO2 +1 enhancer in leukaemia cells. (a) Normalized gene expression data for 72 T-ALL patients having one of the major molecular cytogenetic abnormalities (TAL1, LMO2, HOXA, HOX11 and HOX11L2) shown by heatmap and boxplot. Elevated levels of LMO2 are seen in both the LMO2 and HOXA categories. Corresponding P-values are shown. (b) HOXA5 can transactivate the LMO2 +1 enhancer. Transient co-transfection assays in 293T cells show significant activation of the wild-type enhancer construct (pP/Luc/+1) but not the mutant enhancer with either first three or all HOX sites mutated (pP/Luc/+1HOX1-3mut and pP/Luc/+1HOX1-6mut, respectively). Values are expressed relative to the control pcDNA3, and the mean and s.e.m. for at least two independent transfections (each one performed in triplicate) are shown. (c) Normalized gene expression data for human CD34+ cells, obtained from cord blood, transformed with the leukaemia fusion genes MLL-AF9 (n=9) or AML1-ETO (n=6) shown by boxplot. Greater levels of LMO2 can be observed in the MLL-AF9 category. Corresponding P-value is shown.
Figure 4
Figure 4
Acetylation of histone H3 lysine 9 indicates that the LMO2 +1 enhancer is active in primary AML patient samples showing activation of the HOXA cluster. (a) ChIP-on-chip analysis of the human LMO2 locus in four patient samples shows a peak of H3 lysine 9 acetylation at the LMO2 +1 enhancer. MVista representation of human/mouse sequence conservation is shown at the top with the +1 enhancer highlighted. Annotations are as in Figure 2a. (b) ChIP-on-chip analysis of the HOXA cluster shows elevated H3 lysine 9 acetylation across central/posterior HOXA genes in the same four patient samples. Enrichment values are calculated as fold enrichment over the mean intensity across the whole locus and expressed as log base 2.
Figure 5
Figure 5
Levels of Lmo2 control proliferation in MLL-ENL transduced mouse leukaemic cells and correlate with overall survival in AML patients. (a) MLL-ENL transduced mouse bone marrow cells show enhanced H3 lysine 9 acetylation at the Lmo2 +1 similar to primary patient samples. Shown is an MVista representation of mouse/human sequence conservation with +1 enhancer highlighted, with a CHIP-on-chip results shown underneath. Annotations are as in Figure 2a. (b) MLL-ENL transduced mouse bone marrow cells show enhanced H3 lysine 9 acetylation across the HoxA cluster similar to primary patient samples. An MVista representation of mouse/human sequence conservation with the ChIP-on-chip results underneath is shown. Annotations are as in Figure 2a. (c) The LMO2 +1 element functions as a transcriptional enhancer in MLL-ENL transduced bone marrow progenitors. Cells were electroporated with luciferase reporter constructs containing the pP, the promoter together with the wild-type +1 enhancer, or the promoter with two different mutant versions of +1 enhancer. Mean and s.e.m. for at least two independent transfections (each one performed in triplicate) are shown. Values are expressed relative to the vector containing the luciferase gene under the control of the minimal pP alone (pP-Luc). (d) Knock-down of Lmo2 in MLL-ENL transduced cells results in a competitive growth disadvantage. MLL-ENL immortalized bone marrow progenitors were transduced with constructs containing shRNA against Lmo2 (triangles) or luciferase (squares) as a control. GFP presence was monitored over 25 days after infection and percentages of GFP-positive cells are indicated. The results from a representative experiment performed in duplicate are shown. (e) Overall survival over 3 years in a cohort of 79 AML patients shows statistically significant association with levels of LMO2 expression at diagnosis. Shown is a boxplot of expression levels for patients with overall survival of less (left) and more (right) than 3 years, with the corresponding P-value shown at the top right. (f) Lower LMO2 expression at diagnosis shows a strong association with improved survival. Kaplan–Meier survival curves for AML patients with log 2 expression scores for LMO2 higher than 11.5 (blue curve) or lower than 11.5 (red curve) at diagnosis are shown. Corresponding P-value is also shown.

References

    1. Wadman IA, Osada H, Grutz GG, Agulnick AD, Westphal H, Forster A, et al. The LIM-only protein Lmo2 is a bridging molecule assembling an erythroid, DNA-binding complex which includes the TAL1, E47, GATA-1 and Ldb1/NLI proteins. EMBO J. 1997;16:3145–3157. - PMC - PubMed
    1. Warren AJ, Colledge WH, Carlton MB, Evans MJ, Smith AJ, Rabbitts TH. The oncogenic cysteine-rich LIM domain protein rbtn2 is essential for erythroid development. Cell. 1994;78:45–57. - PubMed
    1. Boehm T, Foroni L, Kaneko Y, Perutz MF, Rabbitts TH. The rhombotin family of cysteine-rich LIM-domain oncogenes: distinct members are involved in T-cell translocations to human chromosomes 11p15 and 11p13. Proc Natl Acad Sci USA. 1991;88:4367–4371. - PMC - PubMed
    1. Royer-Pokora B, Loos U, Ludwig WD. TTG-2, a new gene encoding a cysteine-rich protein with the LIM motif, is overexpressed in acute T-cell leukaemia with the t(11;14)(p13;q11) Oncogene. 1991;6:1887–1893. - PubMed
    1. Fisch P, Boehm T, Lavenir I, Larson T, Arno J, Forster A, et al. T-cell acute lymphoblastic lymphoma induced in transgenic mice by the RBTN1 and RBTN2 LIM-domain genes. Oncogene. 1992;7:2389–2397. - PubMed

Publication types

MeSH terms