. 2014 Apr 17;33(16):2040-52.
doi: 10.1038/onc.2013.173. Epub 2013 May 27.

Phosphorylation of Nanog is essential to regulate Bmi1 and promote tumorigenesis

Affiliations

Phosphorylation of Nanog is essential to regulate Bmi1 and promote tumorigenesis

X Xie et al. Oncogene. .

Abstract

Emerging evidence indicates that Nanog is intimately involved in tumorigenesis, in part, through regulation of the cancer-initiating cell (CIC) population. However, the regulation and role of Nanog in tumorigenesis are still poorly understood. In this study, human Nanog was identified to be phosphorylated by human protein kinase Cɛ at multiple residues, including T200 and T280. Our work indicated that phosphorylation at T200 and T280 modulates Nanog function through several regulatory mechanisms. Results with phosphorylation-insensitive and phosphorylation-mimetic mutant Nanog revealed that phosphorylation at T200 and T280 enhance Nanog protein stability. Moreover, phosphorylation-insensitive T200A and T280A mutant Nanog had a dominant-negative function to inhibit endogenous Nanog transcriptional activity. Inactivation of Nanog was due to impaired homodimerization, DNA binding, promoter occupancy and p300, a transcriptional co-activator, recruitment resulting in a defect in target gene-promoter activation. Ectopic expression of phosphorylation-insensitive T200A or T280A mutant Nanog reduced cell proliferation, colony formation, invasion, migration and the CIC population in head and neck squamous cell carcinoma (HNSCC) cells. The in vivo cancer-initiating ability was severely compromised in HNSCC cells expressing phosphorylation-insensitive T200A or T280A mutant Nanog; 87.5% (14/16), 12.5% (1/8), and 0% (0/8) for control, T200A, and T280A, respectively. Nanog occupied the Bmi1 promoter to directly transactivate and regulate Bmi1. Genetic ablation and rescue experiments demonstrated that Bmi1 is a critical downstream signaling node for the pleiotropic, pro-oncogenic effects of Nanog. Taken together, our study revealed, for the first time, that post-translational phosphorylation of Nanog is essential to regulate Bmi1 and promote tumorigenesis.


Conflict of interest statement

Conflict of Interest

The authors declare no conflict of interest.

Figures

Figure 1
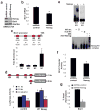
Figure 1. Phosphorylation enhances Nanog transcriptional activity
(a) PKCε phosphorylates Nanog in vitro. Recombinant human wildtype Nanog was incubated with or without recombinant human wildtype PKCε in kinase buffer containing PKC activators, phosphatidylserine and diacylglycerol, and ATP for 30 minutes at 25°C. Subsequently, the incubation reaction was terminated, separated by SDS-PAGE, and stained using SYPRO Ruby and Pro-Q Diamond to visualized total protein and phosphorylated protein, respectively. (b) Phosphopeptide mapping of Nanog. Nanog was phosphorylated with PKCε in vitro and digested with enzymes to generate peptide fragments. Nanog peptide fragments were analyzed with liquid chromatography-mass spectrometry/mass spectrometry (LC-MS/MS) to identify the phosphorylation sites. (c) Nanog transcriptional activity. HEK293/Nanog-TRE cells were transfected with empty vector (control), V5-tagged wildtype Nanog, V5-tagged T78A mutant Nanog, V5-tagged S79A mutant Nanog, V5-tagged S135A mutant Nanog, V5-tagged T200A mutant Nanog, or V5-tagged T280A mutant Nanog and selected in antibiotics to generate stable polyclonal populations. V5-tagged wildtype/mutant Nanog levels were assessed by immunoblot analysis. Nanog transcriptional activity was measured using a luminometer. Data is presented and mean ± SEM. *P<0.001, n=5, control vs. mutant Nanog; **P<0.001, n=5, control vs. wildtype Nanog. (d and e) Validation of phospho-T200 and phospho-T280 Nanog antibodies. (d) Competition with phosphopeptide or nonphosphopeptide. Phospho-T200 antibody were incubated with 10X molar excess of phosphopeptide (PMWSNQ[pT]WNNSTW) or nonphosphopeptide (PMWSNQTWNNSTW). Phospho-T280 antibody were incubated with 10X molar excess of phosphopeptide (LNVIQQ[pT]TRYFST) or nonphosphopeptide (LNVIQQTTRYFST). The antibody:peptide mixtures were incubated overnight at 4°C and subsequently used to detect phosphorylated Nanog using UMSCC74A lysates. (e) Detection of recombinant T200A and T280A mutant Nanog. Recombinant T200A and T280A mutant Nanog were separated by SDS-PAGE and transferred to nitrocellulose membrane. Phosphorylation of Nanog at T200 and T280 was assessed by immunoblot analysis with phospho-T200 and phospho-T280 Nanog antibodies. (f) PKCε phosphorylates Nanog in vivo. HEK293 cells were transduced with Cignal Lenti Nanog Reporter and stable polyclonal HEK293/Nanog-TRE cells were generated by selection in puromycin. HEK293/Nanog-TRE cells were transfected with empty vector (control) or constitutive active (A159E) PKCε. PKCε, Nanog, and phospho-T200/T280 levels were assessed by immunoblot analysis. Nanog transcriptional activity was measured using a luminometer. Data is presented and mean ± SEM. *P<0.0001, n=5.
Figure 2
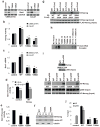
Figure 2. Phosphorylation enhances Nanog protein stability
(a) PKCε, Nanog, phospho-T200/T280 Nanog, and Bmi1 levels in HNSCC cells. Protein levels were assessed using immunoblot analysis. (b) PKCε, Nanog, phospho-T200/T280 Nanog, and Bmi1 levels in PKCε-deficient UMSCC74A cells. UMSCC74A/inducible shRNA-PKCε cells were induced with vehicle or doxycycline for 48 hours. Protein levels were assessed using immunoblot analysis. (c) Nanog protein half-life. Stable polyclonal UMSCC74A/V5-wildtype Nanog, UMSCC74A/V5-T200A, UMSCC74A/V5-T200D, UMSCC74A/V5-T280A, and UMSCC74A/V5-T280D cells were treated with cycloheximide (10 μM) for 1, 2, 3, and 4 hours. Cell lysates were prepared and assessed for V5-tagged Nanog levels using immunoblot analysis. Representative blots are shown from 3 independent experiments.
Figure 3
Figure 3. Nanog regulates Bmi1 through promoter occupancy
(a) Genetic ablation of Nanog reduces Bmi1 levels. Cell lysates were prepared and assessed for Nanog and Bmi1 levels by immunoblot analysis. (b) Bmi1 mRNA expression. Total mRNA was prepared using Trizol and qPCR analysis was performed using validated Bmi1 TaqMan primers. Data is presented as mean ± SEM. *P<0.01, n=3. (c) Nanog occupies the Bmi1 promoter. Bmi1 promoter analysis identified four putative Nanog binding sites. ChIP was performed on UMSCC74A cells using an anti-Nanog or anti-IgG antibody. Immunoprecipitated complexes were detected with real-time qPCR using primers specific to the N1, N2, N3, and N4 sites in the Bmi1 promoter. Fold enrichment was normalized to anti-IgG and presented as mean ± SEM. *P<0.001, n=4. (d) Bmi1 promoter activity. HEK293/empty and HEK293/wildtype Nanog cells were co-transfected with the 4.1 kb, 0.9 kb (contains N1 site only), or 0.9 kb/ΔN1 (deletion of N1 site) Bmi1 promoter-Renilla luciferase and the CMV-Firefly luciferase plasmids. Bmi1 promoter activity was normalized with CMV-Firefly luciferase to control for transfection efficiency and presented as mean ± SEM. *P<0.005, n=3, empty vs. WT Nanog using 4.1 kb or 0.9 kb Bmi1 promoter; **P<0.005, n=3, 4.1 kb or 0.9 kb Bmi1 promoter vs. 0.9 kb/ΔN1 Bmi1 promoter in control or WT Nanog cells. (e) Electrophoretic mobility shift assay. Recombinant human wildtype Nanog was assessed for binding to the wildtype or mutant N1 oligonucleotides using EMSA (top panel). Competition EMSA was performed by incubating nuclear extracts from UMSCC74A cells with excess (1X or 10X molar) unlabeled wildtype or mutant N1 oligonucleotides in the presence of labeled wildtype N1 oligonucleotide (bottom panel, left lanes). Supershift assay using an anti-Nanog antibody was performed to confirm Nanog binding to the N1 site (bottom panel, right lanes). (f) Bmi1 promoter activity. Bmi1 promoter (0.9 kb) activity was measured using a luminometer. Data is normalized to shRNA-control and presented as mean ± SEM. *P<0.001, n=5. (g) Bmi1 promoter occupancy. ChIP was performed on UMSCC74A/shRNA-control and UMSCC74A/shRNA-Nanog cells using an anti-Nanog or anti-IgG antibody. Immunoprecipitated complexes were detected with real-time qPCR using a primer set specific to the N1 site in the Bmi1 promoter. ChIP with an anti-IgG antibody was used as the negative control. % input was normalized to anti-IgG for shRNA-control and shRNA-Nanog. Data is normalized to shRNA-control and presented as mean ± SEM. *P<0.0001, n=4.
Figure 4
Figure 4. Phosphorylation of Nanog modulates homodimerization and Bmi1 promoter occupancy and transactivation
(a) T200A and T280A mutant Nanog reduce Bmi1 levels in HNSCC cells. UMSCC74A cells were transfected with empty vector (control), wildtype Nanog (WT), T200A mutant Nanog, or T280A mutant Nanog and selected in antibiotics to generate stable polyclonal populations. V5-tagged Nanog and Bmi1 levels were assessed by immunoblot analysis. (b) Nanog transcriptional activity. Nanog transcriptional activity was measured using a luminometer. Data is presented and mean ± SEM. *P<0.0001, n=5. (c) Bmi1 mRNA expression. Total mRNA was prepared using Trizol and qPCR analysis was performed using validated Bmi1 TaqMan primers. Data is presented as mean ± SEM. *P<0.01, n=3. (d) Bmi1 promoter activity. Bmi1 promoter (0.9 kb or 0.9 kb/ΔN1) activity was measured using a luminometer. Relative Bmi1 promoter-luciferase activity is shown and presented as mean ± SEM. *P<0.001, n=3, control vs. WT Nanog using the 0.9 kb Bmi1 promoter; **P<0.001, n=3, 0.9 kb Bmi1 promoter vs. 0.9 kb/ΔN1 Bmi1 promoter. (e) Bmi1 promoter activity. Bmi1 promoter (0.9 kb) activity was measured using a luminometer. Data is normalized to control and presented as mean ± SEM. *P<0.001, n=5, control vs. T200A or T280A. (f) Nanog localization. Cytosolic (C) and nuclear (N) proteins were isolated from V5-tagged wildtype, T200A, and T280A Nanog UMSCC74A cells. V5-Nanog was detected by immunoblot analysis. (g) Nanog homodimerization. HEK293 cells were co-transfected with V5-tagged wildtype/mutant Nanog and FLAG-tagged wildtype/mutant Nanog. Cell lysates were immunoprecipitated with an anti-FLAG antibody and immunoblotted with an anti-V5 antibody. Input controls for V5-tagged wildtype/mutant Nanog and FLAG-tagged wildtype/mutant Nanog are presented. (h) DNA binding. Recombinant FLAG-tagged wildtype/mutant Nanog was assessed for binding to the Site1 response element in the Bmi1 promoter using EMSA. (i) p300 association. UMSCC74A cells were untransfected or transfected with V5-tagged wildtype Nanog or mutant Nanog and stable polyclonal populations were selected. Cell lysates from UMSCC74A (upper panel) or UMSCC74A/control, UMSCC74A/wildtype Nanog, or UMSCC74A/mutant Nanog (lower panel) were immunoprecipitated with an anti-p300 antibody and immunoblotted with an anti-Nanog or anti-V5 antibody. Input controls for p300 and V5-tagged Nanog are presented. (j) Bmi1 promoter occupancy. Chromatin immunoprecipitation was performed using an anti-p300 or anti-V5 antibody. Immunoprecipitated complexes were detected with real-time PCR using a primer set specific to the N1 site in the Bmi1 promoter. Chromatin immunoprecipitation with an anti-IgG antibody was used as the negative control. Data (% input) is normalized to IgG and presented as mean ± SEM. *P<0.0001, n=4.
Figure 5
Figure 5. Pleiotropic anti-cancer effects of phosphorylation-insensitive Nanog mutants
(a) Clonogenic survival. Colonies were stained with crystal violet. *P<0.01, n=3. (b) Cell invasion. Cell invasion was assessed using the Modified Boyden chamber invasion assay with Matrigel basement membrane. *P<0.01, n=3. (c) Cell migration. Cell migration was assessed using the wound healing assay. *P<0.01, n=3. (d) Cancer initiating cell number and size. Cells were harvested and seeded on low-attachment plates in a defined, serum-free culture medium at a density of 300 cells/well. Tumorspheres were allowed to grow for 7 days. Tumorsphere formation efficiency was calculated as the number of tumorspheres (≥ 50 μm in diameter) formed divided by the original number of cells seeded. Data is presented as mean ± SEM. *P<0.01, n=6. A representative tumorsphere is shown for each cell line. Scale bar, 50 μm. (e) In vivo tumor incidence. UMSCC74A-control, UMSCC74A-T200A, and UMSCC74A-T280A cells (1×10⁶ cells) were suspended in DMEM (50:50 Matrigel) and implanted subcutaneously in the flanks of athymic nude mice. Tumor incidence was monitored for 68 days post-implantation.
Figure 6
Figure 6. Bmi1 is essential for Nanog-induced tumorigenesis
(a) Bmi1 rescue in Nanog-deficient and T280A mutant Nanog cells. Cell lysates were prepared and assessed for Bmi1 levels by immunoblot analysis. (b) Clonogenic survival. Colonies were stained with crystal violet and counted. * P<0.01, n=3. (c) Cell invasion. Cell invasion was assessed using the Modified Boyden chamber invasion assay with Matrigel basement membrane. *P<0.01, n=3. (d) Cell migration. Cell migration was assessed using the wound healing assay. *P<0.01, n=3. (e) Cancer initiating cell number and size. Cells were harvested and seeded on low-attachment plates in a defined, serum-free culture medium at a density of 300 cells/well. Tumorspheres were allowed to grow for 7 days. Tumorsphere formation efficiency was calculated as the number of tumorspheres (≥ 50 μm in diameter) formed divided by the original number of cells seeded. Data is presented as mean ± SEM. *P<0.01, n=6.
Figure 7
Figure 7. A proposed model of the PKCε-Nanog-Bmi1 signaling axis in tumorigenesis
PKCε phosphorylates Nanog at T200 and T280 to enhance Nanog stability, homodimerization and Bmi1 promoter occupancy. Subsequently, the p300 co-activator is recruited to facilitate Bmi1 promoter transactivation.

Similar articles

Cited by

References

    1. Niwa H, Miyazaki J, Smith AG. Quantitative expression of Oct-3/4 defines differentiation, dedifferentiation or self-renewal of ES cells. Nat Genet. 2000 Apr;24(4):372–6. - PubMed
    1. Mitsui K, Tokuzawa Y, Itoh H, Segawa K, Murakami M, Takahashi K, et al. The homeoprotein Nanog is required for maintenance of pluripotency in mouse epiblast and ES cells. Cell. 2003 May 30;113(5):631–42. - PubMed
    1. Masui S, Nakatake Y, Toyooka Y, Shimosato D, Yagi R, Takahashi K, et al. Pluripotency governed by Sox2 via regulation of Oct3/4 expression in mouse embryonic stem cells. Nat Cell Biol. 2007 Jun;9(6):625–35. - PubMed
    1. Torres J, Watt FM. Nanog maintains pluripotency of mouse embryonic stem cells by inhibiting NFkappaB and cooperating with Stat3. Nat Cell Biol. 2008 Feb;10(2):194–201. - PubMed
    1. Zhang P, Andrianakos R, Yang Y, Liu C, Lu W. Kruppel-like factor 4 (Klf4) prevents embryonic stem (ES) cell differentiation by regulating Nanog gene expression. J Biol Chem. 2010 Mar 19;285(12):9180–9. - PMC - PubMed

Publication types

MeSH terms