. 2014 Apr 24;33(17):2157-68.
doi: 10.1038/onc.2013.178. Epub 2013 May 27.

The NuRD complex cooperates with DNMTs to maintain silencing of key colorectal tumor suppressor genes

Affiliations

The NuRD complex cooperates with DNMTs to maintain silencing of key colorectal tumor suppressor genes

Y Cai et al. Oncogene. .

Abstract

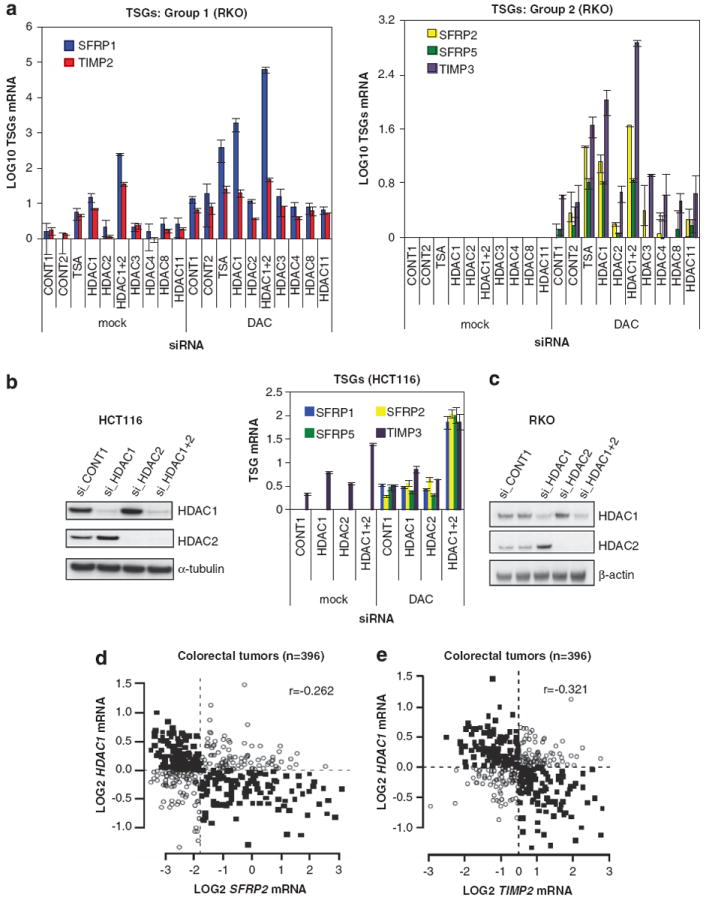
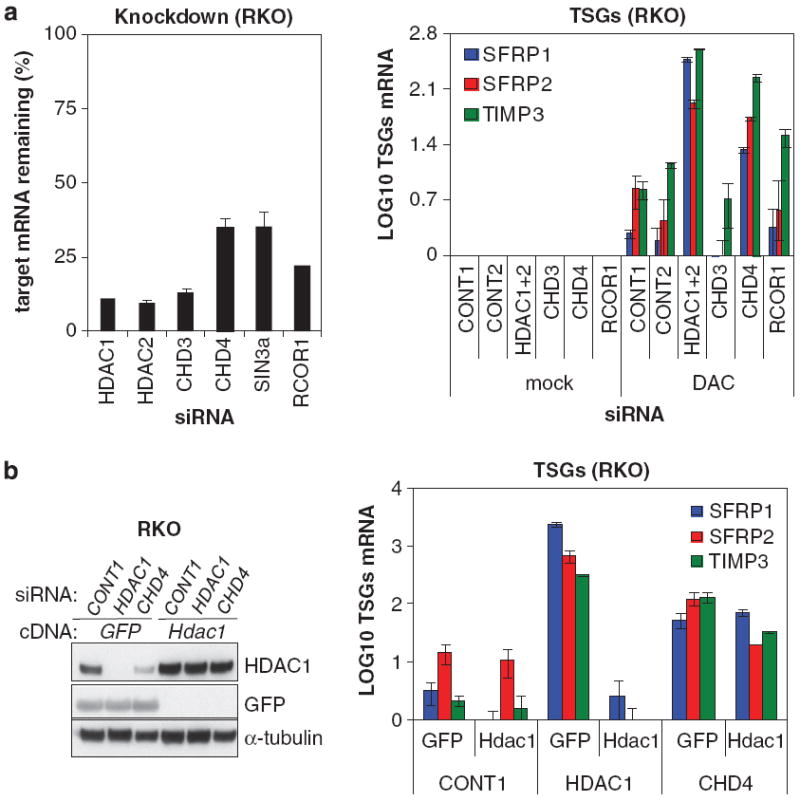
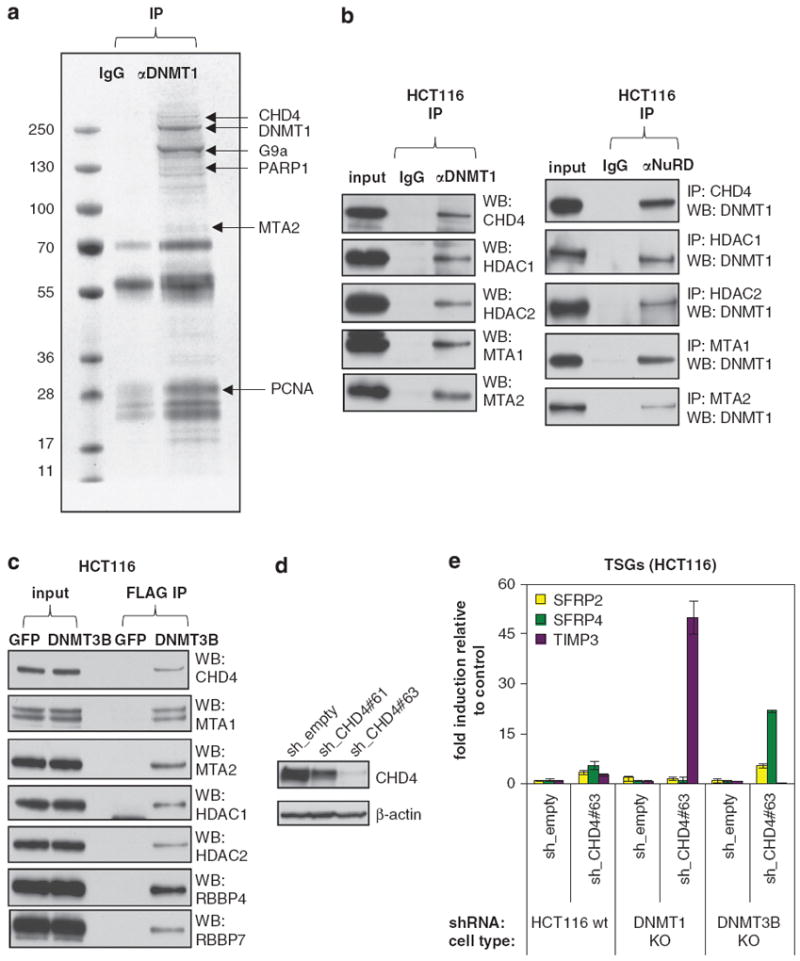
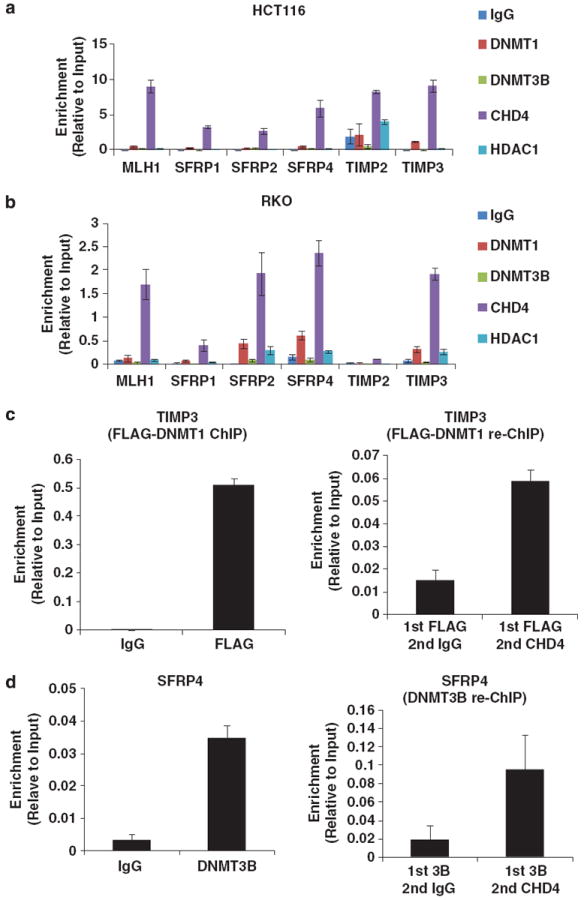
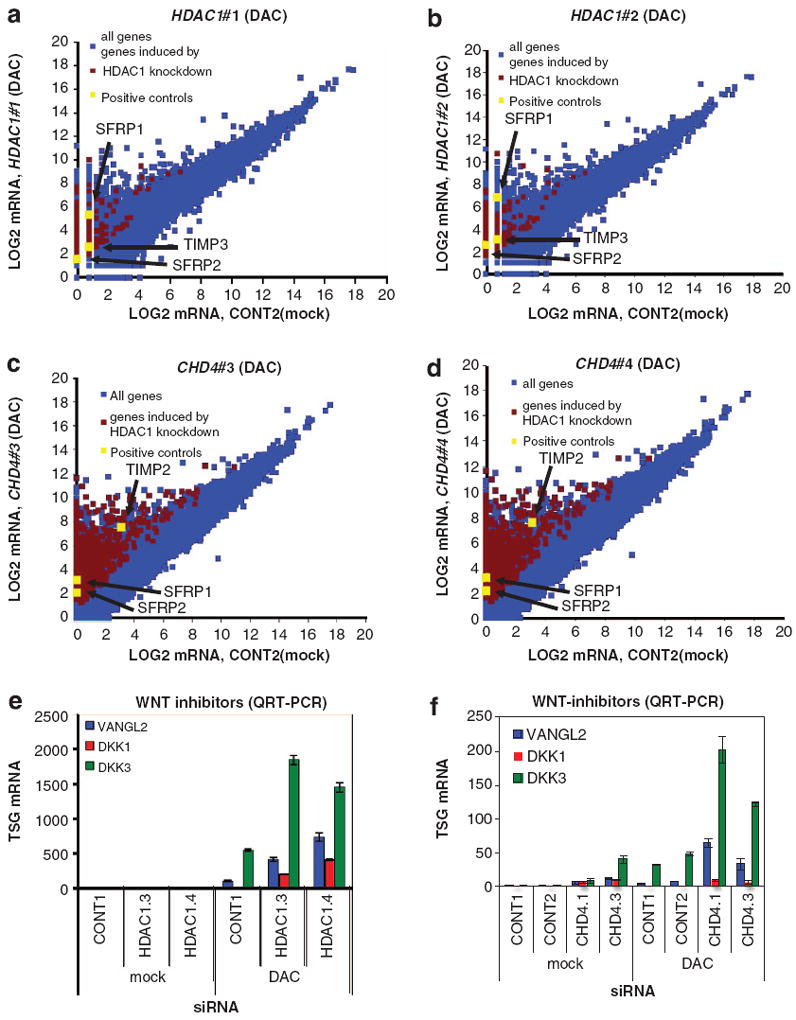
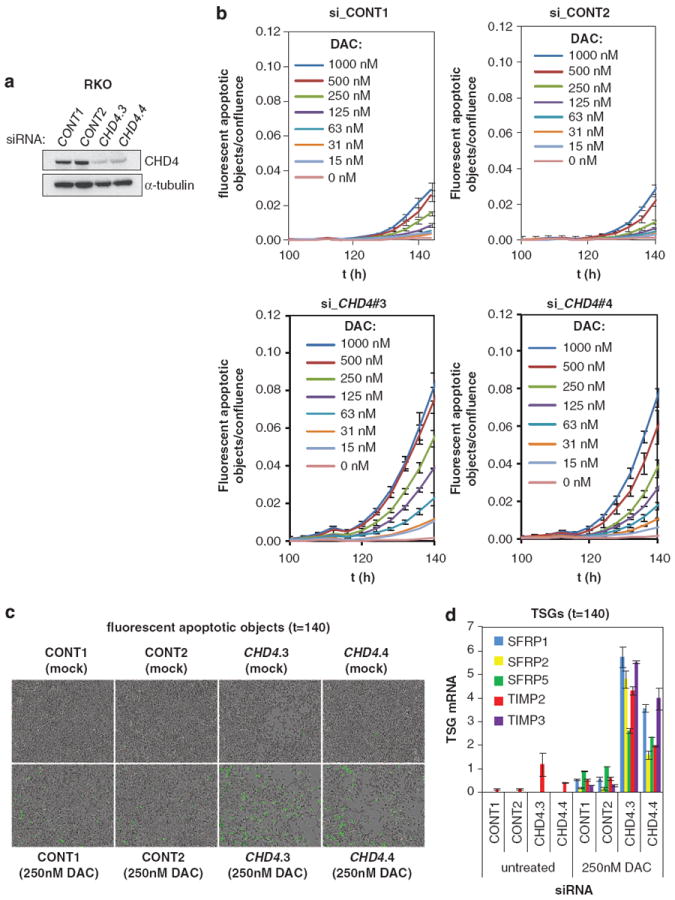
Many tumor suppressor genes (TSGs) are silenced through synergistic layers of epigenetic regulation including abnormal DNA hypermethylation of promoter CpG islands, repressive chromatin modifications and enhanced nucleosome deposition over transcription start sites. The protein complexes responsible for silencing of many of such TSGs remain to be identified. Our previous work demonstrated that multiple silenced TSGs in colorectal cancer cells can be partially reactivated by DNA demethylation in cells disrupted for the DNA methyltransferases 1 and 3B (DNMT1 and 3B) or by DNMT inhibitors (DNMTi). Herein, we used proteomic and functional genetic approaches to identify additional proteins that cooperate with DNMTs in silencing these key silenced TSGs in colon cancer cells. We discovered that DNMTs and the core components of the NuRD (Mi-2/nucleosome remodeling and deacetylase) nucleosome remodeling complex, chromo domain helicase DNA-binding protein 4 (CHD4) and histone deacetylase 1 (HDAC1) occupy the promoters of several of these hypermethylated TSGs and physically and functionally interact to maintain their silencing. Consistent with this, we find an inverse relationship between expression of HDAC1 and 2 and these TSGs in a large panel of primary colorectal tumors. We demonstrate that DNMTs and NuRD cooperate to maintain the silencing of several negative regulators of the WNT and other signaling pathways. We find that depletion of CHD4 is synergistic with DNMT inhibition in reducing the viability of colon cancer cells in correlation with reactivation of TSGs, suggesting that their combined inhibition may be beneficial for the treatment of colon cancer. Since CHD4 has ATPase activity, our data identify CHD4 as a potentially novel drug target in cancer.


Conflict of interest statement

CONFLICT OF INTEREST

The authors declare no conflict of interest.

Figures

Figure 1
Figure 1
DNMT inhibition and knockdown of HDAC1 and 2 synergize in reactivating silenced TSGs. (a) DNMT inhibition and knockdown of HDAC1 and 2 synergize in reactivation of TSGs. RKO cells were transfected with scrambled siRNAs (CONT1 and 2) or siRNA pools targeting HDAC1-11, split and then treated with or without 1 μm DAC. Only the HDAC siRNA pools that induced >70% knockdown were included in the analysis. RKO cells were also treated with 300 nm TSA in the absence and presence of DAC. Expression of indicated TSGs was measured by QRT-PCR and Log10 transformed, using the lowest Ct value measured (see Materials and methods). Error bars denote s.d. See also Supplementary Figure S1A. (b) Depletion of HDAC1 and 2 enhances DAC-induced reactivation of TSGs in HCT116 cells. HCT116 cells were transfected with CONT1, HDAC1 and/or HDAC2 siRNA pools, split and treated with or without 100 nm DAC. Knockdown was verified by analyzing HDAC1 and HDAC2 protein expression by western blotting, α-tubulin serves as a loading control (left panel). Expression of indicated TSGs was measured by QRT-PCR (right panel). Error bars denote s.d. (c) HDAC1 and HDAC2 siRNA pools induce depletion of HDAC1 and HDAC2 protein levels. RKO cells were transfected with scrambled, HDAC1 and/or HDAC2 siRNA pools. HDAC1 and HDAC2 protein expression was analyzed by western blotting, β-actin serves as a loading control. (d, e) Inverse correlation of HDAC1 and expression of TSGs. Correlation plots of HDAC1 and SFRP2 (d) or TIMP2 (e) were drawn using gene expression data sets of 396 colorectal tumors. Expression levels are indicated as Log2 ratios against a colon cancer reference pool. Median expression levels are indicated by the dashed lines. Solid square symbols represent discordant binary expression (low and high levels) and open circles indicate concordant expression between HDAC1 and TSGs. See also Table 1.
Figure 2
Figure 2
HDAC1 requires the NuRD complex for silencing of TSGs. (a) DNMT inhibition and knockdown of CHD4 induce reactivation of TSGs. RKO cells were transfected with scrambled (CONT1 and 2), HDAC1, HDAC2, CHD3, CHD4 and RCOR1 siRNA pools, split and treated with or without 1 μm DAC. The knockdown abilities of the siRNA pools are depicted as the relative mRNA remaining compared with scrambled siRNA pools (left) Expression of indicated TSGs was analyzed by QRT-PCR and Log10 transformed (right). Error bars denote s.d. (b) HDAC1 requires CHD4 for silencing of TSGs. RKO cells were transfected with CONT1, human-specific HDAC1#1 and CHD4 siRNA pool, split, treated with 1 μm DAC and transduced with plasmids overexpressing GFP or wild-type Hdac1. Expression of mouse Hdac1, human HDAC1 and GFP was analyzed by western blotting with an antibody recognizing GFP and an antibody recognizing both human and mouse HDAC1, α-tubulin serves as a loading control (left panel). Expression of indicated TSGs was determined by QRT-PCR and Log10 transformed (right panel). Error bars denote s.d.
Figure 3
Figure 3
Physical and functional interactions between DNMTs and NuRD. (a) Purification and mass spectrometric analysis of polypeptides associating with DNMT1 identifies NuRD. Endogenous DNMT1 was immunoprecipitated from HCT116 cells, resolved by SDS–PAGE and stained. IgG served as a negative control. Protein bands were retrieved and analyzed by mass spectrometry. The bands are labeled with the identified proteins. See also Supplementary Table S1. (b) Physical interaction between DNMT1 and the NuRD complex. Nuclear extracts from HCT116 cells were immunoprecipitated with antibodies against either DNMT1 (left) or NuRD complex subunits (right). Immunoprecipitates were immunoblotted using the indicated antibodies. (c) Physical interaction between DNMT3B and the NuRD complex. Nuclear extracts from HCT116 DNMT3B KO cells, transfected with vectors overexpressing FLAG-tagged GFP or DNMT3B, were immunoprecipitated with an anti-FLAG M2 affinity gel. The eluted immunoprecipitates were immunoblotted using the indicated antibodies. (d) CHD4 shRNAs induce CHD4 protein depletion. HCT116 cells were transduced with an empty vector or shRNAs targeting CHD4. CHD4 protein levels were analyzed by western blotting, β-actin serves as a loading control. (e) Functional cooperation between CHD4 and either DNMT1 or DNMT3B in silencing TSGs. Wild-type, DNMT1 hypomorphic or DNMT3B −/− HCT116 cells were transduced with an empty vector or a functional shRNA targeting CHD4. Expression of indicated TSGs was analyzed by QRT-PCR and is represented as fold induction over empty vector. Error bars denote s.d.
Figure 4
Figure 4
DNMTs and NuRD associate with the promoters of TSG. (a, b) DNMT1, DNMT3B, HDAC1 and CHD4 associate with the promoters of TSGs in HCT116 and RKO cells. Occupancy of DNMT1, DNMT3B, HDAC1 and CHD4 in the proximal promoter region of indicated TSGs in HCT116 cells (a) and RKO cells (b). Results are presented as percentage of input. Rabbit IgG served as a negative control. (c) DNMT1 and the NuRD complex exists in the same protein complex on the TIMP3 promoter. Re-ChIP experiment was performed in an HCT116 DNMT1 hypomorphic cell line stably expressing FLAG epitope-tagged DNMT1. (d) DNMT3B and the NuRD complex exists in the same protein complex on the SFRP4 promoter. Re-ChIP experiment was performed in HCT116 cells. Error bars denote s.d.
Figure 5
Figure 5
Inhibition of the DNMT–NuRD complex leads to reactivation of silenced genes encoding for WNT antagonists. (a, b) Whole transcriptome analysis of HDAC1 knockdown cells treated with DAC. Depicted are scatter plots of Log2-transformed RNA-seq reads of RKO cells transfected with HDAC1#1 (a) or HDAC1#2 siRNA (b) and treated with DAC in comparison with untreated scrambled (CONT2) siRNA-transfected cells from a single experiment. The stripes are caused by the addition of 1 to all values to avoid negative Log2 values. Genes synergistically reactivated by HDAC1 KD and DAC treatment were selected by these criteria: (1) transcripts that could only be reactivated by both HDAC1#1 and HDAC1#2 siRNA and DAC treatment but not by scrambled siRNA and DAC treatment and (2) transcripts that were >2-fold induced by scrambled siRNA and DAC treatment and >2-fold further enhanced by both HDAC1#1 and HDAC1#2 siRNAs. Transcripts enhanced in reactivation by HDAC1 knockdown are highlighted in red with the positive controls SFRP1, SFRP2 and TIMP3 depicted in yellow. (c, d) Whole transcriptome analysis of CHD4 knockdown cells treated with DAC. Depicted are scatter plots of Log2-transformed RNA-seq reads of RKO cells transfected with CHD4#3 (c) or CHD4#4 siRNA (d) and treated with DAC in comparison with untreated scrambled siRNA- (CONT2) transfected cells from three independent biological replicate experiments. Genes synergistically reactivated by CHD4 KD and DAC treatment were selected by these criteria: (1) transcripts that could only be reactivated by both CHD4#3 and CHD4#4 siRNA and DAC treatment but not by scrambled siRNA and DAC treatment and (2) transcripts that were 42-fold induced by scrambled siRNA and DAC treatment and >2-fold further enhanced by CHD4#3 and CHD4#4 siRNAs. Transcripts enhanced in reactivation by CHD4 knockdown are highlighted in red with the positive controls SFRP1, SFRP2 and TIMP2 depicted in yellow. (e, f) Reactivation of WNT inhibitors by HDAC1 or CHD4 depletion and DNMT inhibition. RKO cells were transfected with scrambled, HDAC1 (e) or CHD4 (f) siRNAs and treated with or without 1 μm DAC. Expression of indicated WNT inhibitors was analyzed by QRT-PCR. Error bars denote s.d.
Figure 6
Figure 6
DAC and knockdown of CHD4 synergize in cell death induction, in correlation with reactivation of TSGs. (a) CHD4 siRNAs induce depletion of CHD4. RKO cells were transduced with scrambled (CONT1-2) or CHD4 siRNAs. CHD4 knockdown was verified by examining CHD4 protein levels, α-tubulin serves as a loading control. (b) Knockdown of CHD4 sensitizes RKO cells to DAC treatment. RKO cells from (a) were untreated or treated with indicated concentrations of DAC. Kinetic measures of the number of caspase-3/7-positive cells, recorded over time and plotted as fluorescent objects, divided by confluence are shown. n = 3 wells per data point shown, error bars denote s.d. (c, d) Knockdown of CHD4 induces synthetic sickness lethality with DNMTi in association with TSG reactivation. RKO cells from (a, b) were untreated or treated with 250 nm DAC and analyzed for caspase 3 and 7 activation by time-lapse microscopy after 140 h (c) and analyzed for TSG reactivation by QRT-PCR (d). Error bars denote s.d.

References

    1. Ting AH, McGarvey KM, Baylin SB. The cancer epigenome—components and functional correlates. Genes Dev. 2006;20:3215–3231. - PubMed
    1. Jones PA, Baylin SB. The epigenomics of cancer. Cell. 2007;128:683–692. - PMC - PubMed
    1. Portela A, Esteller M. Epigenetic modifications and human disease. Nat Biotechnol. 2010;28:1057–1068. - PubMed
    1. Chodavarapu RK, Feng S, Bernatavichute YV, Chen PY, Stroud H, Yu Y, et al. Relationship between nucleosome positioning and DNA methylation. Nature. 2010;466:388–392. - PMC - PubMed
    1. Choy JS, Wei S, Lee JY, Tan S, Chu S, Lee TH. DNA methylation increases nucleosome compaction and rigidity. J Am Chem Soc. 2010;132:1782–1783. - PMC - PubMed

Publication types

MeSH terms