. 2013 Jun 20;498(7454):363-6.
doi: 10.1038/nature12176. Epub 2013 May 26.

Distinct behavioural and network correlates of two interneuron types in prefrontal cortex

Affiliations

Distinct behavioural and network correlates of two interneuron types in prefrontal cortex

D Kvitsiani et al. Nature. .

Abstract

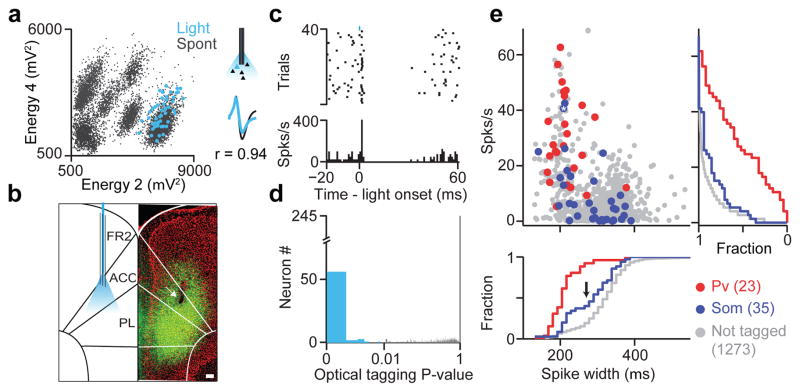
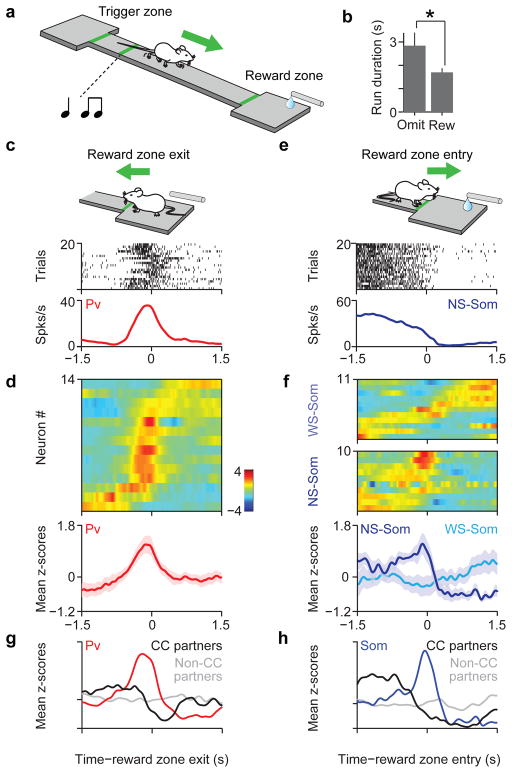
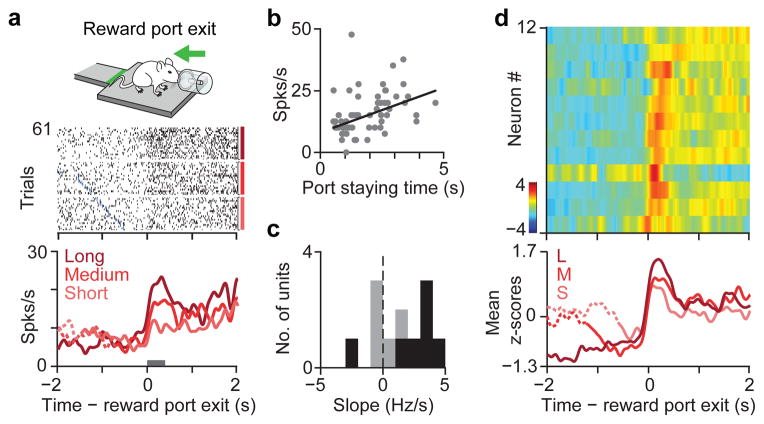
Neurons in the prefrontal cortex exhibit diverse behavioural correlates, an observation that has been attributed to cell-type diversity. To link identified neuron types with network and behavioural functions, we recorded from the two largest genetically defined inhibitory interneuron classes, the perisomatically targeting parvalbumin (PV) and the dendritically targeting somatostatin (SOM) neurons in anterior cingulate cortex of mice performing a reward foraging task. Here we show that PV and a subtype of SOM neurons form functionally homogeneous populations showing a double dissociation between both their inhibitory effects and behavioural correlates. Out of several events pertaining to behaviour, a subtype of SOM neurons selectively responded at reward approach, whereas PV neurons responded at reward leaving and encoded preceding stay duration. These behavioural correlates of PV and SOM neurons defined a behavioural epoch and a decision variable important for foraging (whether to stay or to leave), a crucial function attributed to the anterior cingulate cortex. Furthermore, PV neurons could fire in millisecond synchrony, exerting fast and powerful inhibition on principal cell firing, whereas the inhibitory effect of SOM neurons on firing output was weak and more variable, consistent with the idea that they respectively control the outputs of, and inputs to, principal neurons. These results suggest a connection between the circuit-level function of different interneuron types in regulating the flow of information and the behavioural functions served by the cortical circuits. Moreover, these observations bolster the hope that functional response diversity during behaviour can in part be explained by cell-type diversity.


Conflict of interest statement

The authors declare no competing financial interests.

Figures

Figure 1
Figure 1. Optogenetic tagging of genetically-defined interneurons in behaving mice
a, Spike sorting example. Unclustered spikes plotted in waveform energy space from two tetrode channels. Light-evoked spikes superimposed in blue, Bottom right, average spontaneous and light-evoked waveforms. b, Coronal section from a Som-IRES-Cre mouse (green, ChR2; red, DAPI). Arrow indicates electrolytic lesion of recording site in ACC. Scale bar, 100 μm. ACC, anterior cingulate; PL, prelimbic cortex; FR2, frontal region 2. c, Spike raster (top) and peri-stimulus time histogram (PSTH) (bottom) for the light-activated cell in a, aligned to light onset. Light pulse shown in blue (duration, 1ms; power, ~100mW/mm2; frequency, 10Hz). d, Histogram of SALT (optical tagging test) P-values showed strong bimodal distribution; (P<0.01, blue). e, Firing rate as a function of spike width for Pv, Som and not tagged neurons. Asterisk indicates neuron in (a, c). Cumulative histograms of firing rate (right) and spike width (bottom) are plotted for all groups. Arrow marks mode separation of spike width distribution for Som neurons.
Figure 2
Figure 2. Distinct inhibitory impact of Som and Pv interneurons
a, b (Top), Spike raster and PSTH of Pv (a) and Som (b) interneuron aligned to light onset. (Bottom), PSTH of three simultaneously recorded unidentified neurons. c, Average cross-correlograms (CCG) between Pv-Pv (top left), Pv-Not tagged (bottom left), Som-Som (top right), and Som-Not tagged (bottom right) neuron pairs; examples of significant pairwise interactions (left Inset) and summary for statistically significant CCG interactions (right inset).
Figure 3
Figure 3. Distinct behavioral correlates of Pv and Som interneurons
a, Cartoon of mouse performing the reward foraging task b, Average run duration for rewarded and omission trials (n = 63 sessions, P < 0.05, Mann Whitney U test). c, Spike raster and peri-event time histogram (PETH) for an identified Pv interneuron aligned to time of reward zone exit. d, Top, z-scored PETHs of 14 Pv neurons sorted by latency to half-peak firing; bottom, mean z-scored response (shaded area indicates S.E.M.). e, Spike raster and PETH for a NS-Som interneuron aligned to time of reward zone entry. f, Top, z-scored PETHs of 21 Som neurons. NS-Som and WS-Soms are separated. Bottom, mean responses for NS-Som and WS-Som neurons. g, average PETH for Pv interneurons (red, n=4), with significant inhibitory cross-correlations, (CC-partners, black, n=5) and non-CC partners (gray, n=76). h, Average PETH for Som interneurons (blue, n=3), CC-partners (black, n=3) and non-CC partners (gray, n=34)
Figure 4
Figure 4. Pv interneurons in ACC signal stay duration at foraging decisions
a, Mouse exiting the reward port (inset). Response of a Pv neuron during reward port exit. Raster is sorted by staying time in the port and grouped into terciles. Blue ticks denote water valve offset. PETH is shown for each tercile. b, Linear regression between firing rate of neuron in (a), (epoch indicated by a gray bar) and staying time is significantly positive (r=0.16, slope, 3.63, P<0.005). c, Histogram of regression slopes for all Pv neurons. Black bars indicate significant (P < 0.05) regression. d, Top, z-scored PETHs of 12 Pv neurons aligned to reward-port exit sorted according to latency of half-peak firing. Bottom, average PETH for Pv population grouped into staying time terciles.

References

    1. Constantinidis C, Williams GV, Goldman-Rakic PS. A role for inhibition in shaping the temporal flow of information in prefrontal cortex. Nature Neuroscience. 2002;5:175–180. - PubMed
    1. Machens CK, Romo R, Brody CD. Functional, but not anatomical, separation of “what” and “when” in prefrontal cortex. The Journal of Neuroscience: The Official Journal of the Society for Neuroscience. 2010;30:350–360. - PMC - PubMed
    1. Narayanan NS, Laubach M. Top-Down Control of Motor Cortex Ensembles by Dorsomedial Prefrontal Cortex. Neuron. 2006;52:921–931. - PMC - PubMed
    1. Wallis JD, Kennerley SW. Heterogeneous reward signals in prefrontal cortex. Current opinion in neurobiology. 2010;20:191–198. - PMC - PubMed
    1. Isaacson JS, Scanziani M. How inhibition shapes cortical activity. Neuron. 2011;72:231–243. - PMC - PubMed

Publication types