. 2013 Aug;30(8):1788-802.
doi: 10.1093/molbev/mst099. Epub 2013 May 24.

Efficient moment-based inference of admixture parameters and sources of gene flow

Affiliations

Efficient moment-based inference of admixture parameters and sources of gene flow

Mark Lipson et al. Mol Biol Evol. 2013 Aug.

Abstract

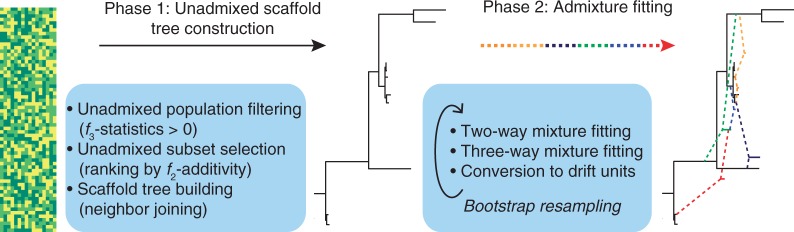
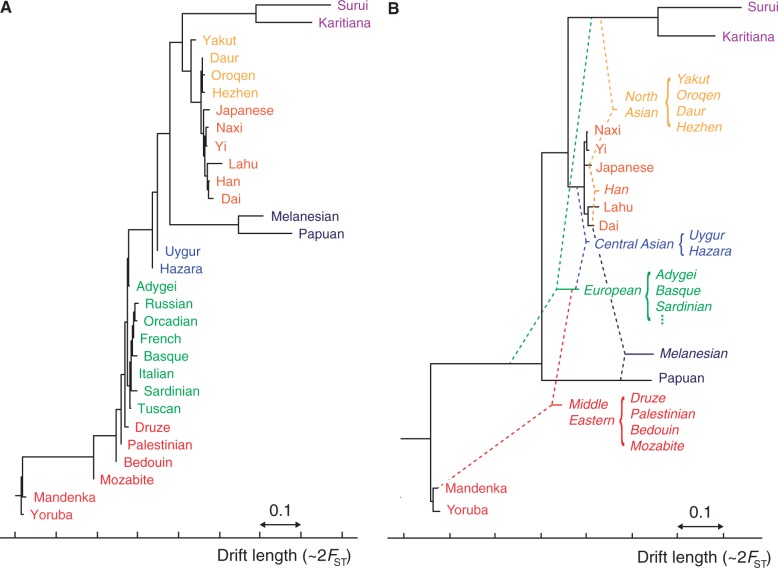
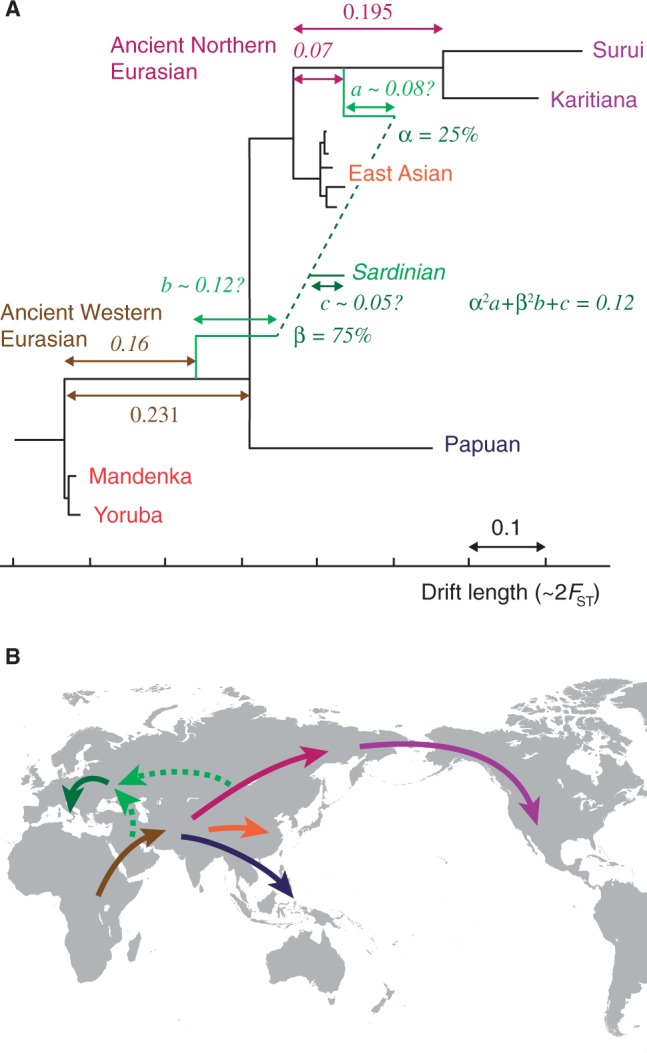
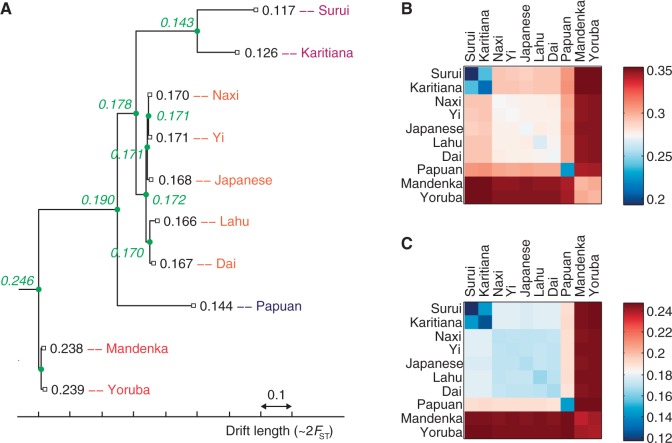
The recent explosion in available genetic data has led to significant advances in understanding the demographic histories of and relationships among human populations. It is still a challenge, however, to infer reliable parameter values for complicated models involving many populations. Here, we present MixMapper, an efficient, interactive method for constructing phylogenetic trees including admixture events using single nucleotide polymorphism (SNP) genotype data. MixMapper implements a novel two-phase approach to admixture inference using moment statistics, first building an unadmixed scaffold tree and then adding admixed populations by solving systems of equations that express allele frequency divergences in terms of mixture parameters. Importantly, all features of the model, including topology, sources of gene flow, branch lengths, and mixture proportions, are optimized automatically from the data and include estimates of statistical uncertainty. MixMapper also uses a new method to express branch lengths in easily interpretable drift units. We apply MixMapper to recently published data for Human Genome Diversity Cell Line Panel individuals genotyped on a SNP array designed especially for use in population genetics studies, obtaining confident results for 30 populations, 20 of them admixed. Notably, we confirm a signal of ancient admixture in European populations-including previously undetected admixture in Sardinians and Basques-involving a proportion of 20-40% ancient northern Eurasian ancestry.

Keywords: admixture; genetic drift; human populations; moment statistics.


Figures

F<sc>ig</sc>. 1.
Fig. 1.
MixMapper workflow. MixMapper takes as input an array of SNP calls annotated with the population to which each individual belongs. The method then proceeds in two phases, first building a tree of (approximately) unadmixed populations and then attempting to fit the remaining populations as admixtures. In the first phase, MixMapper produces a ranking of possible unadmixed trees in order of deviation from f2-additivity; based on this list, the user selects a tree to use as a scaffold. In the second phase, MixMapper tries to fit remaining populations as two- or three-way mixtures between branches of the unadmixed tree. In each case, MixMapper produces an ensemble of predictions via bootstrap resampling, enabling confidence estimation for inferred results.
F<sc>ig</sc>. 2.
Fig. 2.
Schematic of mixture parameters fit by MixMapper. (A) A simple two-way admixture. MixMapper infers four parameters when fitting a given population as an admixture. It finds the optimal pair of branches between which to place the admixture and reports the following: Branch1Loc and Branch2Loc are the points at which the mixing populations split from these branches (given as pre-split length/total branch length); α is the proportion of ancestry from Branch1 (formula image 
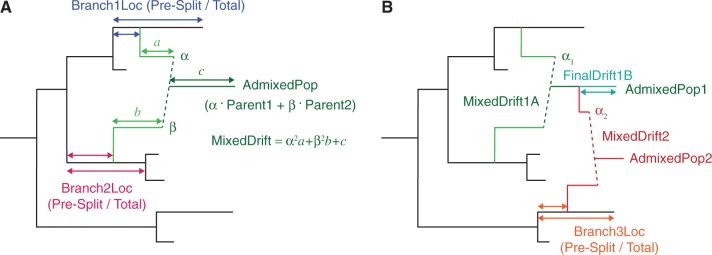
is the proportion from Branch2); and MixedDrift is the linear combination of drift lengths formula image. (B) A three-way mixture: here AdmixedPop2 is modeled as an admixture between AdmixedPop1 and Branch3. There are now four additional parameters; three are analogous to the above, namely, Branch3Loc, formula image, and MixedDrift2. The remaining degree of freedom is the position of the split along the AdmixedPop1 branch, which divides MixedDrift into MixedDrift1A and FinalDrift1B.
F<sc>ig</sc>. 3.
Fig. 3.
Results with simulated data. (A–C) First simulated admixture tree, with one admixed population. Shown are (A) the true phylogeny, (B) MixMapper results, and (C) TreeMix results. (D–F) Second simulated admixture tree, with four admixed populations. Shown are (D) the true phylogeny, (E) MixMapper results, and (F) TreeMix results. In (A) and (D), dotted lines indicate instantaneous admixtures, whereas arrows denote continuous (unidirectional) gene flow over 40 generations. Both MixMapper and TreeMix infer point admixtures, depicted with dotted lines in (B) and (E) and colored arrows in (C) and (F). In (B) and (E), the terminal drift edges shown for admixed populations represent half the total mixed drift. Full inferred parameters from MixMapper are given in supplementary table S1, Supplementary Material online.
F<sc>ig</sc>. 4.
Fig. 4.
Aggregate phylogenetic trees of HGDP populations with and without admixture. (A) A simple neighbor-joining tree on the 30 populations for which MixMapper produced high-confidence results. This tree is analogous to the one given by (Li et al. 2008, fig. 1B), and the topology is very similar. (B) Results from MixMapper. The populations appear in roughly the same order, but the majority are inferred to be admixed, as represented by dashed lines (cf. Pickrell and Pritchard 2012 and supplementary fig. S4, Supplementary Material online). Note that drift units are not additive, so branch lengths should be interpreted individually.
F<sc>ig</sc>. 5.
Fig. 5.
Inferred ancient admixture in Europe. (A) Detail of the inferred ancestral admixture for Sardinians (other European populations are similar). One mixing population splits from the unadmixed tree along the common ancestral branch of Native Americans (“Ancient Northern Eurasian”) and the other along the common ancestral branch of all non-Africans (“Ancient Western Eurasian”). Median parameter values are shown; 95% bootstrap confidence intervals can be found in table 1. The branch lengths a, b, and c are confounded, so we show a plausible combination. (B) Map showing a sketch of possible directions of movement of ancestral populations. Colored arrows correspond to labeled branches in (A).
F<sc>ig</sc>. 6.
Fig. 6.
Ancestral heterozygosity imputed from original Illumina versus San-ascertained SNPs. (A) The 10-population unadmixed tree with estimated average heterozygosities using SNPs from Panel 4 (San ascertainment) of the Affymetrix Human Origins array (Patterson et al. 2012). Numbers in black are direct calculations for modern populations, whereas numbers in green are inferred values at ancestral nodes. (B, C) Computed ancestral heterozygosity at the common ancestor of each pair of modern populations. With unbiased data, values should be equal for pairs having the same common ancestor. (B) Values from a filtered subset of approximately 250,000 SNPs from the published Illumina array data (Li et al. 2008). (C) Values from the Human Origins array excluding SNPs in gene regions.

References

    1. Albrechtsen A, Nielsen F, Nielsen R. Ascertainment biases in SNP chips affect measures of population divergence. Mol Biol Evol. 2010;27:2534–2547. - PMC - PubMed
    1. Bramanti B, Thomas M, Haak W, et al. (11 co-authors) Genetic discontinuity between local hunter-gatherers and Central Europe’s first farmers. Science. 2009;326:137–140. - PubMed
    1. Cavalli-Sforza L, Edwards A. Phylogenetic analysis: models and estimation procedures. Am J Hum Genet. 1967;19:233–257. - PMC - PubMed
    1. Chikhi L, Bruford M, Beaumont M. Estimation of admixture proportions: a likelihood-based approach using Markov chain Monte Carlo. Genetics. 2001;158:1347–1362. - PMC - PubMed
    1. Clark A, Hubisz M, Bustamante C, Williamson S, Nielsen R. Ascertainment bias in studies of human genome-wide polymorphism. Genome Res. 2005;15:1496–1502. - PMC - PubMed

Publication types

LinkOut - more resources