

A model of the membrane-bound cytochrome b5-cytochrome P450 complex from NMR and mutagenesis data
- PMID: 23709268
- PMCID: PMC3724662
- DOI: 10.1074/jbc.M112.448225
A model of the membrane-bound cytochrome b5-cytochrome P450 complex from NMR and mutagenesis data
Abstract
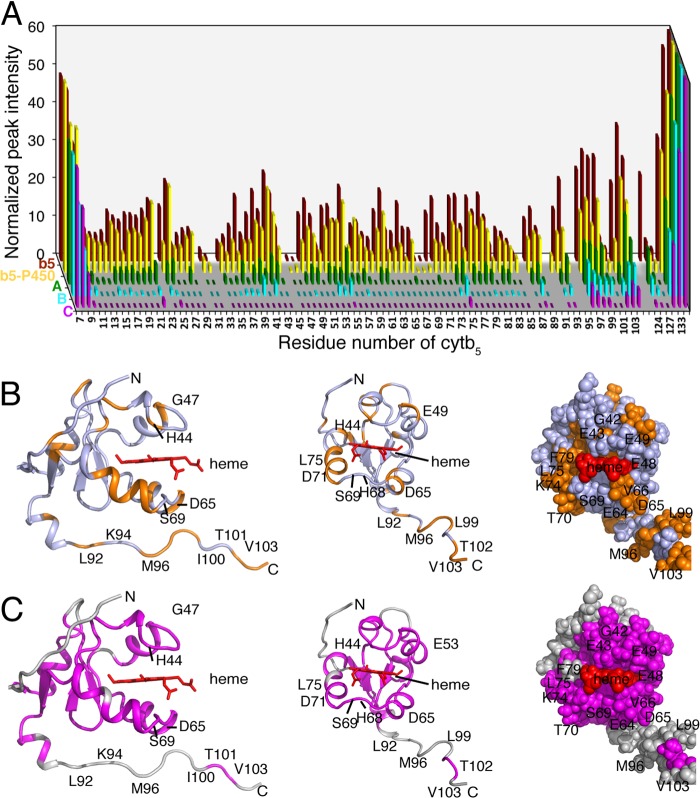
Microsomal cytochrome b5 (cytb5) is a membrane-bound protein that modulates the catalytic activity of its redox partner, cytochrome P4502B4 (cytP450). Here, we report the first structure of full-length rabbit ferric microsomal cytb5 (16 kDa), incorporated in two different membrane mimetics (detergent micelles and lipid bicelles). Differential line broadening of the cytb5 NMR resonances and site-directed mutagenesis data were used to characterize the cytb5 interaction epitope recognized by ferric microsomal cytP450 (56 kDa). Subsequently, a data-driven docking algorithm, HADDOCK (high ambiguity driven biomolecular docking), was used to generate the structure of the complex between cytP4502B4 and cytb5 using experimentally derived restraints from NMR, mutagenesis, and the double mutant cycle data obtained on the full-length proteins. Our docking and experimental results point to the formation of a dynamic electron transfer complex between the acidic convex surface of cytb5 and the concave basic proximal surface of cytP4502B4. The majority of the binding energy for the complex is provided by interactions between residues on the C-helix and β-bulge of cytP450 and residues at the end of helix α4 of cytb5. The structure of the complex allows us to propose an interprotein electron transfer pathway involving the highly conserved Arg-125 on cytP450 serving as a salt bridge between the heme propionates of cytP450 and cytb5. We have also shown that the addition of a substrate to cytP450 likely strengthens the cytb5-cytP450 interaction. This study paves the way to obtaining valuable structural, functional, and dynamic information on membrane-bound complexes.
Keywords: Cytochrome P450; Enzyme Catalysis; Membrane Proteins; NMR; Structural Biology.
Figures


Similar articles
-
Expression, purification, and functional reconstitution of 19F-labeled cytochrome b5 in peptide nanodiscs for NMR studies.Biochim Biophys Acta Biomembr. 2020 May 1;1862(5):183194. doi: 10.1016/j.bbamem.2020.183194. Epub 2020 Jan 15. Biochim Biophys Acta Biomembr. 2020. PMID: 31953231 Free PMC article.
-
Cytochrome-P450-cytochrome-b5 interaction in a membrane environment changes 15N chemical shift anisotropy tensors.J Phys Chem B. 2013 Nov 7;117(44):13851-60. doi: 10.1021/jp4086206. Epub 2013 Oct 28. J Phys Chem B. 2013. PMID: 24107224 Free PMC article.
-
Effects of membrane mimetics on cytochrome P450-cytochrome b5 interactions characterized by NMR spectroscopy.J Biol Chem. 2015 May 15;290(20):12705-18. doi: 10.1074/jbc.M114.597096. Epub 2015 Mar 20. J Biol Chem. 2015. PMID: 25795780 Free PMC article.
-
The cytochrome b5-fold: an adaptable module.Biochimie. 1994;76(7):674-92. doi: 10.1016/0300-9084(94)90144-9. Biochimie. 1994. PMID: 7893819 Review.
-
Another look at the interaction between mitochondrial cytochrome c and flavocytochrome b (2).Eur Biophys J. 2011 Dec;40(12):1283-99. doi: 10.1007/s00249-011-0697-0. Epub 2011 Apr 19. Eur Biophys J. 2011. PMID: 21503671 Review.
Cited by
-
Structure of CrgA, a cell division structural and regulatory protein from Mycobacterium tuberculosis, in lipid bilayers.Proc Natl Acad Sci U S A. 2015 Jan 13;112(2):E119-26. doi: 10.1073/pnas.1415908112. Epub 2014 Dec 29. Proc Natl Acad Sci U S A. 2015. PMID: 25548160 Free PMC article.
-
Shortening spin-lattice relaxation using a copper-chelated lipid at low-temperatures - A magic angle spinning solid-state NMR study on a membrane-bound protein.J Magn Reson. 2013 Dec;237:175-181. doi: 10.1016/j.jmr.2013.10.017. Epub 2013 Nov 1. J Magn Reson. 2013. PMID: 24246881 Free PMC article.
-
Detergent-free extraction, reconstitution and characterization of membrane-anchored cytochrome-b5 in native lipids.Chem Commun (Camb). 2020 Jun 18;56(48):6511-6514. doi: 10.1039/d0cc01737j. Epub 2020 May 28. Chem Commun (Camb). 2020. PMID: 32462144 Free PMC article.
-
Expression, purification, and functional reconstitution of 19F-labeled cytochrome b5 in peptide nanodiscs for NMR studies.Biochim Biophys Acta Biomembr. 2020 May 1;1862(5):183194. doi: 10.1016/j.bbamem.2020.183194. Epub 2020 Jan 15. Biochim Biophys Acta Biomembr. 2020. PMID: 31953231 Free PMC article.
-
Identification of productive and futile encounters in an electron transfer protein complex.Proc Natl Acad Sci U S A. 2017 Mar 7;114(10):E1840-E1847. doi: 10.1073/pnas.1616813114. Epub 2017 Feb 21. Proc Natl Acad Sci U S A. 2017. PMID: 28223532 Free PMC article.
References
-
- Guengerich F. P., Wu Z. L., Bartleson C. J. (2005) Function of human cytochrome P450s: characterization of the orphans. Biochem. Biophys. Res. Commun. 338, 465–469 - PubMed
-
- Shen A. L., O'Leary K. A., Kasper C. B. (2002) Association of multiple developmental defects and embryonic lethality with loss of microsomal NADPH-cytochrome p450 oxidoreductase. J. Biol. Chem. 277, 6536–6541 - PubMed
-
- Nebert D. W., Russell D. W. (2002) Clinical importance of the cytochromes P450. Lancet 360, 1155–1162 - PubMed
-
- O'Donnell A., Judson I., Dowsett M., Raynaud F., Dearnaley D., Mason M., Harland S., Robbins A., Halbert G., Nutley B., Jarman M. (2004) Hormonal impact of the 17α-hydroxylase/C(17,20)-lyase inhibitor abiraterone acetate (CB7630) in patients with prostate cancer. Br. J. Cancer 90, 2317–2325 - PMC - PubMed
-
- Orlando L., Schiavone P., Fedele P., Calvani N., Nacci A., Rizzo P., Marino A., D'Amico M., Sponziello F., Mazzoni E., Cinefra M., Fazio N., Maiello E., Silvestris N., Colucci G., Cinieri S. (2010) Molecularly targeted endocrine therapies for breast cancer. Cancer Treat. Rev. 36, S67–S71 - PubMed
Publication types
MeSH terms
Substances
Associated data
- Actions
Grants and funding
LinkOut - more resources
Full Text Sources
Other Literature Sources
