. 2013 Nov;55(3):217-26.
doi: 10.1007/s12033-013-9672-6.

A defined methodology for reliable quantification of Western blot data

Affiliations

A defined methodology for reliable quantification of Western blot data

Sean C Taylor et al. Mol Biotechnol. 2013 Nov.

Abstract

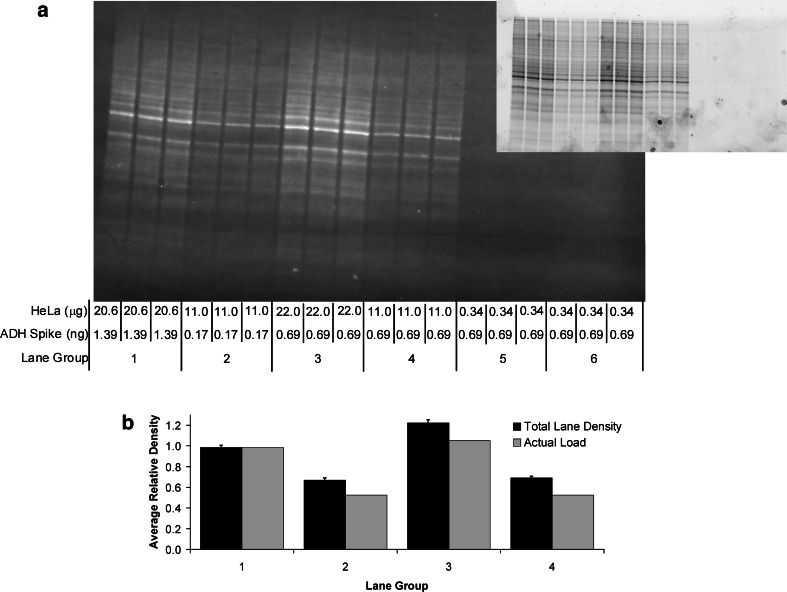
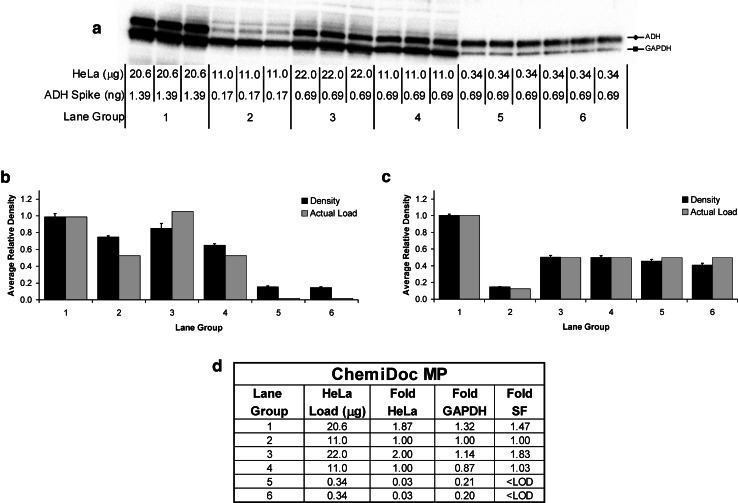
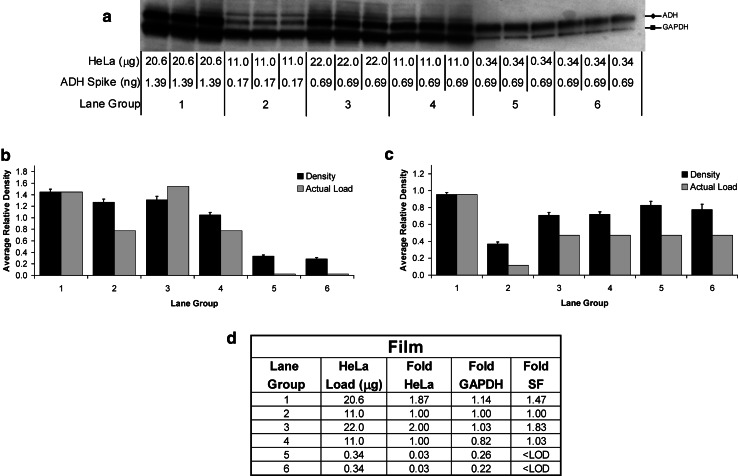
Chemiluminescent western blotting has been in common practice for over three decades, but its use as a quantitative method for measuring the relative expression of the target proteins is still debatable. This is mainly due to the various steps, techniques, reagents, and detection methods that are used to obtain the associated data. In order to have confidence in densitometric data from western blots, researchers should be able to demonstrate statistically significant fold differences in protein expression. This entails a necessary evolution of the procedures, controls, and the analysis methods. We describe a methodology to obtain reliable quantitative data from chemiluminescent western blots using standardization procedures coupled with the updated reagents and detection methods.


Conflict of interest statement

The authors declare no Conflict of Interest

Figures

Fig. 1
Fig. 1
Image acquisition and densitometric analysis. ImageLab software version 4.1 (Bio-Rad) was used for image acquisition and densitometric analysis of the gels, blots, and film in this study. The software interprets the raw data in three dimensions with the length and width of the band defined by the “Lanes and Bands” tool in concert with the “Lane Profile” tool such that the chemiluminescent signal emitted from the blot is registered in the third dimension as a peak rising out of the blot surface. The density of a given band was measured as the total volume under the three-dimensional peak, which could be viewed in two dimensions using the “Lane Profile” tool to adjust the precise width of the band to account for the area under the shaded peak of interest. Background subtraction was set by using the rolling disc setting in the “Lanes” tool. The rolling disc values were set such that the background was subtracted under the band (i.e., peak) of interest in a uniform manner between the lanes of a given blot. In this case, the rolling disc for the two lanes analyzed was set to 18 and 25, respectively, such that the peaks of interest were cut at a consistent level between the markers shown with an “X”
Fig. 2
Fig. 2
Western blot validation with stain-free gel technology. a and c: Images obtained from ChemiDoc MP imager of the gel (a) and transferred blot (c) from a two-fold dilution series of a HeLa cell lysate with spiked-in ADH protein. b and d: Average relative lane density of the total protein load of three gels (b) and the associated blots (d) to determine the linear dynamic range for stain-free detection. Molecular weight markers were run in the first and last two lanes of the gel. AB MWM and US MWM are the Precision Plus All Blue and Unstained molecular weight markers, respectively (Bio-Rad). Error bars represent the standard errors of the mean for three gels and associated blots
Fig. 3
Fig. 3
Defining the linear dynamic range of western blot detection. The chemiluminescent western blot of the two-fold dilution series of the HeLa lysate with spiked-in ADH protein from Fig. 2 was imaged with the ChemiDoc MP (a) and then with film (b). Blotting was performed using a mixture of rabbit- and mouse-derived primary antibodies to ADH and GAPDH, respectively, with the associated mixture of HRP-conjugated secondary antibodies. The average relative density and the standard error of the mean of the imaged bands are plotted against the actual protein load from four blots. The upper and lower bands denote ADH and GAPDH proteins, respectively
Fig. 4
Fig. 4
Contrasting the linear dynamic range of film-based and imager-based detection for ADH. A linear dynamic range of four dilutions for film (a) and seven dilutions for the ChemiDoc MP imager (b) was derived from the dilution series data in Fig. 3. The fold difference in densitometric data within each linear dynamic range correlated to the two-fold dilution series loaded on each blot (c)
Fig. 5
Fig. 5
Verification and validation of western blotting. Four stain-free gels were loaded with measured amounts of HeLa lysate and spiked-in ADH. After separation, the gels were imaged to verify consistent loading (a, inset). The gels were then blotted and the respective blots imaged to validate the transfer efficiency and total lane density for normalization (a). The average relative density of total protein load (as detected from the stain-free fluorescence of the transferred protein in the blots) was compared to the relative difference in μg quantity of HeLa total protein load between the triplicate replicates of each lane group over four blots (b). A positive Pearson Correlation was obtained between total protein load and average relative density of transferred protein (p value of 0.0398)
Fig. 6
Fig. 6
Densitometric analysis of protein bands imaged with the ChemiDoc MP. Quadruplicate chemiluminescent blots (a) were produced after stain-free image analysis (Fig. 5a). Blotting was performed using a mixture of rabbit- and mouse-derived primary antibodies to ADH and GAPDH, respectively, with the associated mixture of HRP-conjugated secondary antibodies. The average relative density of GAPDH (b) and ADH (c) was compared to the relative difference in μg quantity of protein load for the HeLa lysate (b) and the ng quantity of ADH-spike (c) between the triplicate replicates within each lane group over the four blots. The fold difference in stain-free (SF) detected lane density for total protein and GAPDH was compared to that of the μg quantity of actual loading of HeLa lysate (d). A positive Pearson Correlation was obtained for total protein (SF) but not for GAPDH (p values of 0.0398 and 0.155) d. <LOD—below limit of detection
Fig. 7
Fig. 7
Densitometric analysis of blots imaged with film. The same four chemiluminescent blots from Fig. 6 were then imaged with film (a). Blotting was performed using a mixture of rabbit- and mouse-derived primary antibodies to ADH and GAPDH, respectively, with the associated mixture of HRP-conjugated secondary antibodies. The average relative density of GAPDH (b) and ADH (c) was compared to the relative difference in μg quantity of protein load for the HeLa lysate (b) and the ng quantity of ADH-spike (c) between the triplicate replicates within each lane group over four blots. The fold difference in stain-free (SF) detected lane density for total protein and GAPDH was compared to that of the μg quantity of actual loading of HeLa lysate (d). A positive Pearson Correlation was obtained for total protein (SF) but not for GAPDH (p-values of 0.0398 and 0.274 respectively). d. <LOD—below limit of detection

References

    1. Towbin H, Staehelin T, Gordon J. Electrophoretic transfer of proteins from polyacrylamide gels to nitrocellulose sheets: procedure and some applications. PNAS. 1979;76(9):4350–4354. doi: 10.1073/pnas.76.9.4350. - DOI - PMC - PubMed
    1. Bio-Rad Laboratories (2011) Protein Blotting Guide, Interactive PDF. Review B, Bulletin 2895.
    1. Lin JC, Choi EI, Pagano JS. Qualitative and quantitative analyses of Epstein–Barr virus early antigen diffuse component by western blotting enzyme-linked immunosorbent assay with a monoclonal antibody. Journal of Virology. 1985;53:793. - PMC - PubMed
    1. Kurien BT, Scofield RH. Western blotting. Methods. 2006;38(4):283–293. doi: 10.1016/j.ymeth.2005.11.007. - DOI - PubMed
    1. Editorial A picture worth a thousand words (of explanation) Nature Methods. 2006;3(4):237. doi: 10.1038/nmeth0406-237. - DOI

LinkOut - more resources