. 2013:2013:430438.
doi: 10.1155/2013/430438. Epub 2013 Apr 24.

The Relation between Obesity and Survival after Surgical Resection of Hepatitis C Virus-Related Hepatocellular Carcinoma

Affiliations

The Relation between Obesity and Survival after Surgical Resection of Hepatitis C Virus-Related Hepatocellular Carcinoma

Hiroki Nishikawa et al. Gastroenterol Res Pract. 2013.

Abstract

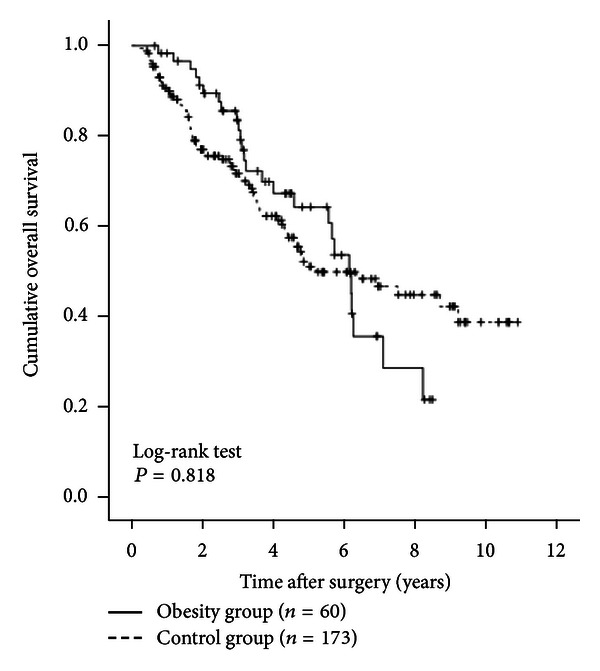
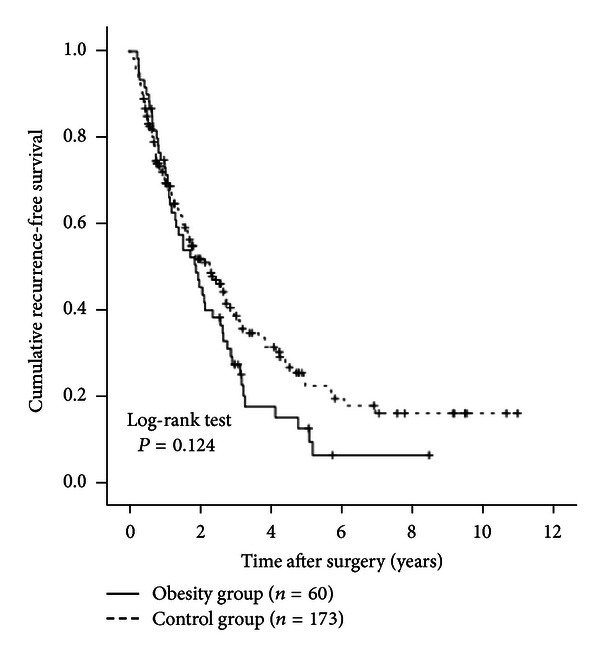
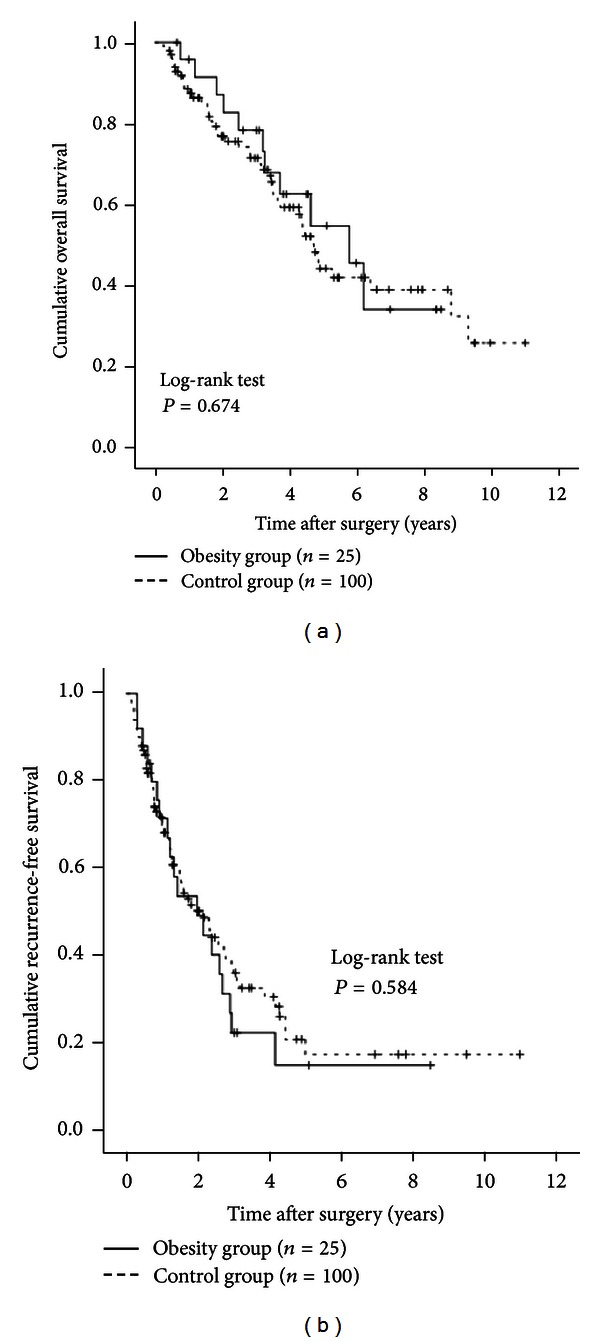
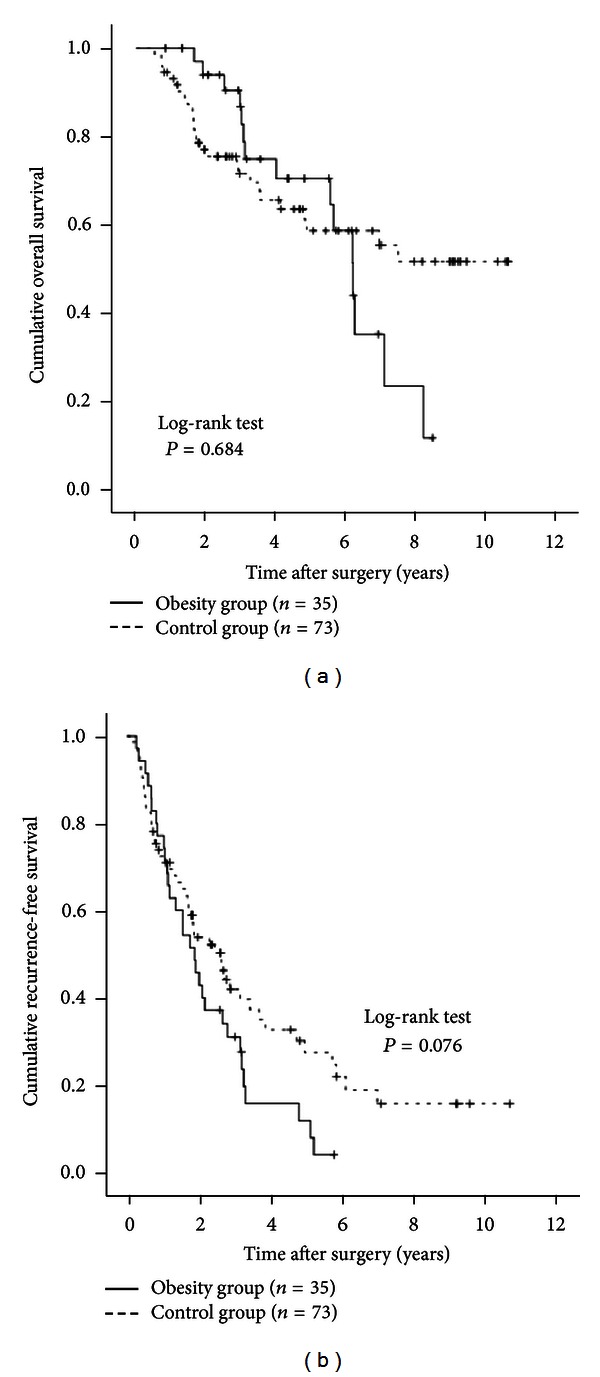
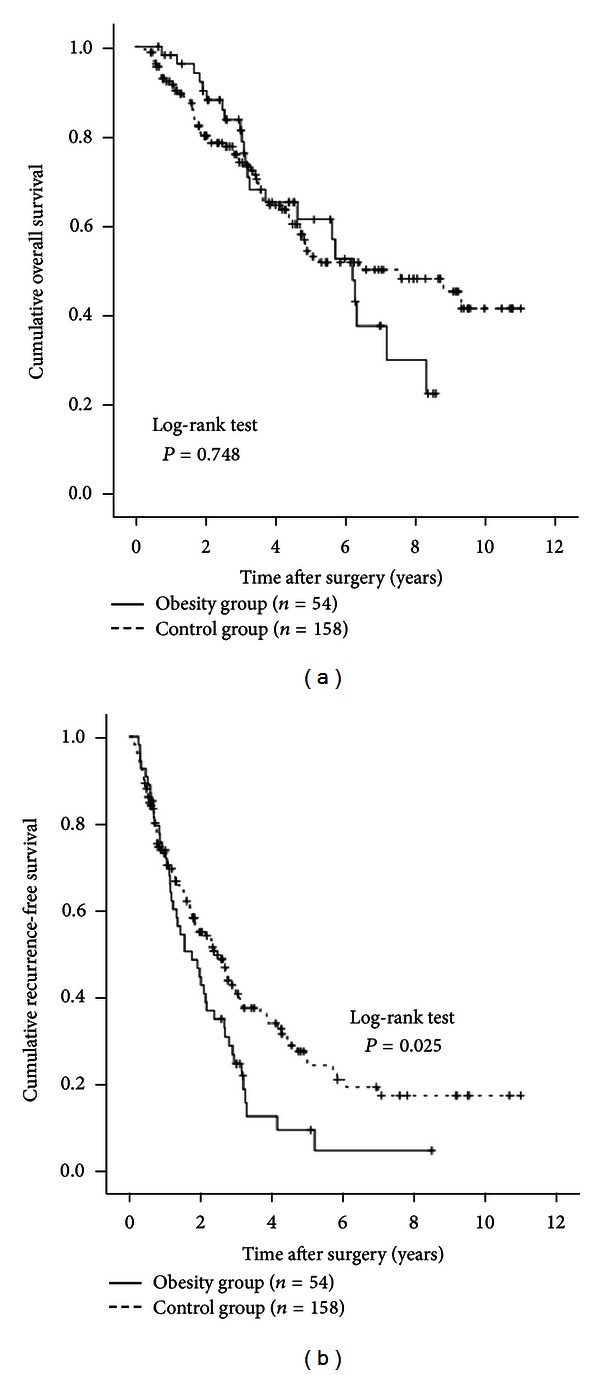
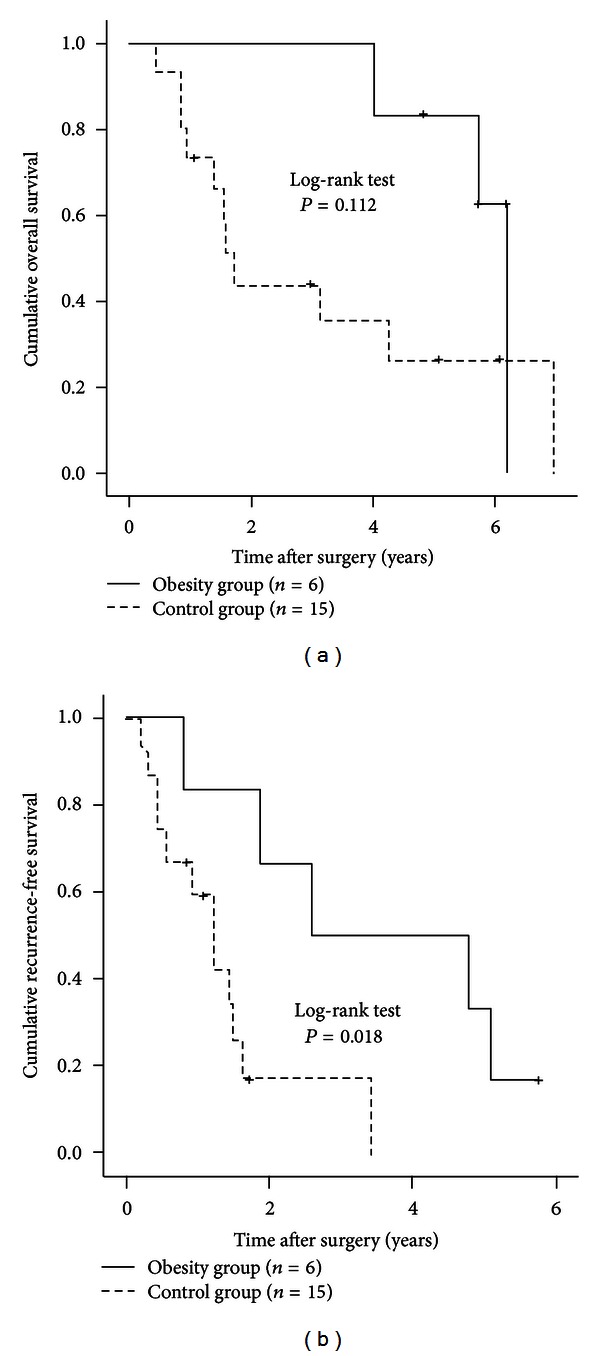
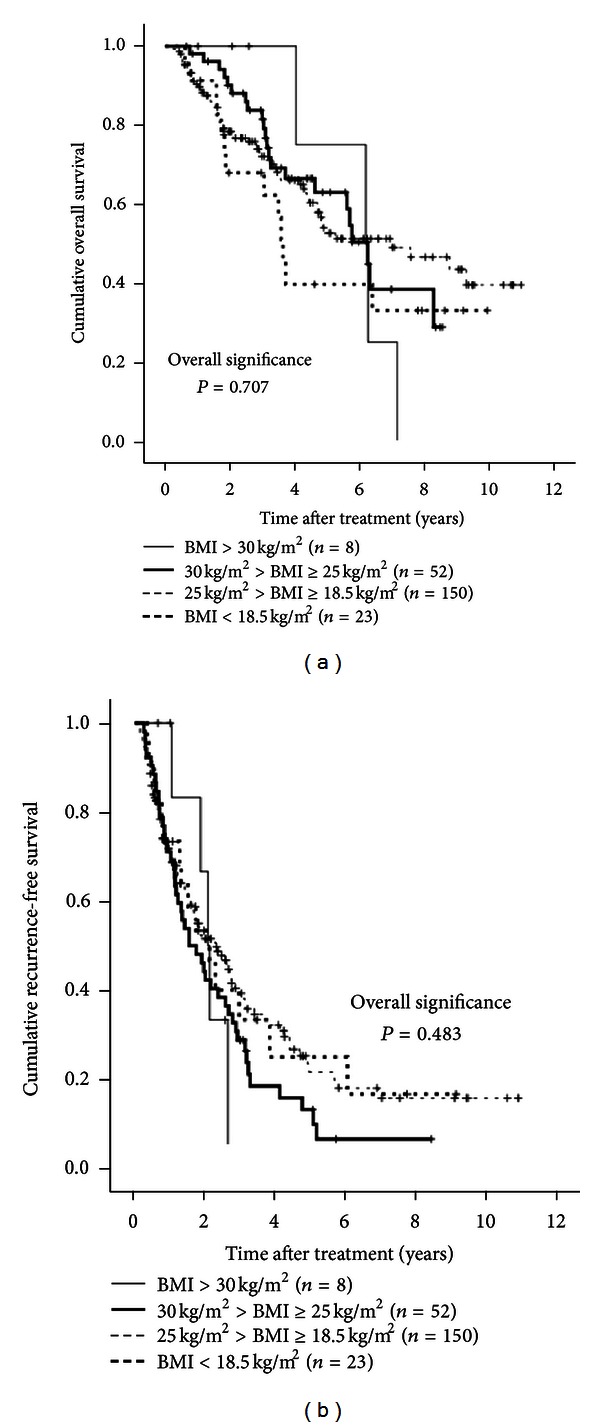
Background and Aims. We aimed to investigate the relationship between obesity and survival in hepatitis C virus-(HCV-) related hepatocellular carcinoma (HCC) patients who underwent curative surgical resection (SR). Methods. A total of 233 patients with HCV-related HCC who underwent curative SR were included. They included 60 patients (25.8%) with a body mass index (BMI) of > 25 kg/m(2) (obesity group) and 173 patients with a BMI of < 25 kg/m(2) (control group). Overall survival (OS) and recurrence-free survival (RFS) rates were compared. Results. The median follow-up periods were 3.6 years in the obesity group and 3.1 years in the control group. The 1-, 3-, and 5-year cumulative OS rates were 98.3%, 81.0%, and 63.9% in the obesity group and 90.0%, 70.5%, and 50.3% in the control group (P = 0.818). The corresponding RFS rates were 70.1%, 27.0%, and 12.0% in the obesity group and 70.1%, 39.0%, and 21.7% in the control group (P = 0.124). There were no significant differences between the obesity group and the control group in terms of blood loss during surgery (P = 0.899) and surgery-related serious adverse events (P = 0.813). Conclusions. Obesity itself did not affect survival in patients with HCV-related HCC after curative SR.


Figures

Figure 1
Figure 1
Study profile.
Figure 2
Figure 2
Cumulative overall survival (OS) rates in the obesity group (n = 60) and the control group (n = 173). The 1-, 3-, and 5-year cumulative OS rates were 98.3%, 81.0%, and 63.9%, respectively, in the obesity group and 90.0%, 70.5%, and 503%, respectively, in the control group (P = 0.818).
Figure 3
Figure 3
Cumulative recurrence-free survival (RFS) rates in the obesity group (n = 60) and the control group (n = 173). The 1-, 3-, and 5-year cumulative RFS rates were 70.1%, 27.0%, and 12.0%, respectively, in the obesity group and 70.1%, 39.0%, and 21.7%, respectively, in the control group (P = 0.124).
Figure 4
Figure 4
Subgroup analyses in patients aged 70 years or more (n = 125). There were 25 patients aged 70 years or more in the obesity group and 100 in the obesity group. There were no significant differences between the two groups in terms of OS (a) (P = 0.674) and RFS (b) (P = 0.584).
Figure 5
Figure 5
Subgroup analyses in patients aged less than 70 years (n = 108). There were 35 patients aged younger than 70 years in the obesity group and 73 in the control group. There were no differences between the two groups in terms of OS (a) (P = 0.684). However, the RFS rates in the obesity group tended to be lower than those in the control group, although the difference did not reach significance (b) (P = 0.076).
Figure 6
Figure 6
Subgroup analyses in patients with the Child-Pugh grade A (n = 212). There were 54 patients with the Child-Pugh grade A in the obesity group and 158 in the control group. In terms of OS (a), there was no significant difference between the two groups (P = 0.748). RFS rates were significantly higher in the control group than in the obesity group (b) (P = 0.025).
Figure 7
Figure 7
Subgroup analyses in patients with the Child-Pugh grade B (n = 21). There were six patients with the Child-Pugh grade B in the obesity group and 15 in the control group. In terms of OS (a), there was no significant difference between the two groups (P = 0.112). However, RFS rates in the obesity group were significantly higher than those in the control group (b) (P = 0.018).
Figure 8
Figure 8
The Kaplan-Meier curves using classification into four groups according to BMI (BMI ≥ 30 kg/m2 (n = 8), 30 kg/m2 > BMI ≥ 25 kg/m2 (n = 152), 25 kg/m2 > BMI ≥ 18.5 kg/m2 (n = 150), and BMI < 18.5 kg/m2 (n = 23)). In terms of overall survival (P = 0.707) and recurrence-free survival (P = 0.483), the overall difference in these four groups did not reach significance ((a) and (b)).

Similar articles

Cited by

References

    1. Livraghi T, Mäkisalo H, Line PD. Treatment options in hepatocellular carcinoma today. Scandinavian Journal of Surgery. 2011;100(1):22–29. - PubMed
    1. de Lope CR, Tremosini S, Forner A, Reig M, Bruix J. Management of HCC. Journal of Hepatology. 2012;56(supplement 1):S75–S87. - PubMed
    1. El-Serag HB. Hepatocellular carcinoma. The New England Journal of Medicine. 2011;365:118–1127. - PubMed
    1. El-Serag HB. Epidemiology of viral hepatitis and hepatocellular carcinoma. Gastroenterology. 2012;142(6):1264–1273. - PMC - PubMed
    1. Umemura T, Ichijo T, Yoshizawa K, Tanaka E, Kiyosawa K. Epidemiology of hepatocellular carcinoma in Japan. Journal of Gastroenterology. 2009;44(19, supplement):102–107. - PubMed

LinkOut - more resources