. 2013:2013:972962.
doi: 10.1155/2013/972962. Epub 2013 Apr 24.

Major Histocompatibility Class II Pathway Is Not Required for the Development of Nonalcoholic Fatty Liver Disease in Mice

Affiliations

Major Histocompatibility Class II Pathway Is Not Required for the Development of Nonalcoholic Fatty Liver Disease in Mice

Gilles Willemin et al. Int J Endocrinol. 2013.

Abstract

Single-nucleotide polymorphisms within major histocompatibility class II (MHC II) genes have been associated with an increased risk of drug-induced liver injury. However, it has never been addressed whether the MHC II pathway plays an important role in the development of nonalcoholic fatty liver disease, the most common form of liver disease. We used a mouse model that has a complete knockdown of genes in the MHC II pathway (MHCII(Δ/Δ)). Firstly we studied the effect of high-fat diet-induced hepatic inflammation in these mice. Secondly we studied the development of carbon-tetra-chloride- (CCl4-) induced hepatic cirrhosis. After the high-fat diet, both groups developed obesity and hepatic steatosis with a similar degree of hepatic inflammation, suggesting no impact of the knockdown of MHC II on high-fat diet-induced inflammation in mice. In the second study, we confirmed that the CCl4 injection significantly upregulated the MHC II genes in wild-type mice. The CCl4 treatment significantly induced genes related to the fibrosis formation in wild-type mice, whereas this was lower in MHCII(Δ/Δ) mice. The liver histology, however, showed no detectable difference between groups, suggesting that the MHC II pathway is not required for the development of hepatic fibrosis induced by CCl4.


Figures

Figure 1
Figure 1
MHCII gene genotyping and hepatic expression in wild-type and MHCIIΔ/Δ mice. (a) Two different PCRs were performed for the detection of wild-type (WT PCR) and knockout (KO PCR: MHCIIΔ/Δ) fragments; 173 bp for a WT band and 209 bp for a KO band. Therefore heterozygous (Het) presents both bands. (b) Gene expression of MHC II genes (H2-Eb1, -Aa, -Ab1) in liver samples by real-time RT-PCR. The expression was normalized by β2 microglobulin and compared to the wild-type. Open bars represent wild-type and closed bars MHCIIΔ/Δ mice (n = 10–14/group). Data are presented as mean ± SEM. *Significantly different from wild-type mice, P < 0.05 (Student t-test).
Figure 2
Figure 2
Effect of high-fat diet on metabolic parameters in wild-type and MHCIIΔ/Δ mice. Open circle/bars represent wild-type and closed circle/bars MHCIIΔ/Δ mice (wild-type: n = 25, MHCIIΔ/Δ: n = 20). Data are presented as mean ± SEM. (a) Body weight gain during 4-month diet. (b) Glucose tolerance test was performed around the 15th week of the intervention. (c) Liver weight at 16th week. (d) Fasting plasma insulin concentration at 16th week. (e) Fasting blood glucose concentration at 16th week.
Figure 3
Figure 3
Effect of high-fat diet on liver enzymes, lipids, and inflammatory markers in wild-type and MHCIIΔ/Δ mice. Open bars represent wild-type and closed bars MHCIIΔ/Δ mice (wild-type: n = 25, MHCIIΔ/Δ: n = 20). Data are presented as mean ± SEM. (a) Plasma ALT level at 16th week. (b) Plasma AST level. (c) Liver triglyceride content at 16th week. (d) Fasting active plasma PAI-1 concentration at 16th week. (e) Gene expression related to inflammation and fibrogenesis in the liver at 16th week.
Figure 4
Figure 4
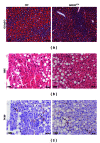
Effect of high-fat diet on liver histology in wild-type and MHCIIΔ/Δ mice. (a) Oil red O staining (red color represents the lipid accumulation). (b) Hematoxylin and eosin (H&E) staining. (c) F4/80 immunohistochemistry (macrophages were stained in brown: arrows).
Figure 5
Figure 5
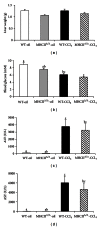
Effect of 4-week CCl4 treatment on liver and blood glucose in wild-type and MHCIIΔ/Δ mice. Open bars represent oil-treated wild-type (WT-oil), closed bars CCl4-treated wild-type (WT-CCl4), gray bars oil-treated MHCIIΔ/Δ mice, and semiclosed bars CCl4-treated MHCIIΔ/Δ mice (wild-type oil: n = 7, MHCIIΔ/Δ oil: n = 5, wild-type CCl4: n = 11, MHCIIΔ/Δ CCl4: n = 9). Data are presented as mean ± SEM. (a) Liver weight. (b) Fasting blood glucose decreased after the CCl4 treatment in both groups. (c), (d) Strong increase in fasting plasma ALT and AST was observed after the CCl4 treatment. a, b, c P < 0.05, ANOVA and Tukey Kramer HSD test. Different letters indicate the significant difference between groups.
Figure 6
Figure 6
Effect of 4-week CCl4 treatment on hepatic gene expression and fibrosis in wild-type and MHCIIΔ/Δ mice. Open bars represent oil-treated wild-type (WT-oil, n = 7), closed bars CCl4-treated wild-type (WT-CCl4, n = 11), gray bars oil-treated MHCIIΔ/Δ mice (MHCIIΔ/Δ-oil, n = 5), semiclosed bars CCl4-treated MHCIIΔ/Δ mice (MHCIIΔ/Δ-CCl4, n = 9). Data are presented as mean ± SEM. (a) MHC II gene expression. (b) Gene expression related to fibrosis formation. (c) Gene expression related to inflammation. (d) No difference in fibrosis (%) between groups treated by CCl4. The percentage was determined based on the sirius red staining (5 pictures/mice, WT-CCl4: n = 5, MHCIIΔ/Δ-CCl4: n = 8). a, b, c P < 0.05, ANOVA and Tukey Kramer HSD test. Different letters indicate the significant difference between groups.
Figure 7
Figure 7
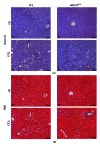
Effect of 4-week CCl4 treatment on liver histology in wild-type and MHCIIΔ/Δ mice. (a) Sirius red staining for collagen. The red staining represents fibrotic area. (b) Hematoxylin and eosin (H&E) staining.
Figure 8
Figure 8
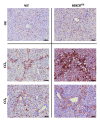
Effect of 4-week CCl4 treatment on macrophage staining in wild-type and MHCIIΔ/Δ mice. Macrophage staining (F4/80) showed a strong inflammation in both groups treated by CCl4.
Figure 9
Figure 9
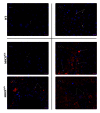
Effect of 4-week CCl4 treatment on GFAP staining in wild-type and MHCIIΔ/Δ mice. Glial fibrillary acidic protein (GFAP; white arrows) was stained in red. Increased positive staining was observed in CCl4-treated MHCIIΔ/Δ mice. Blue: DAPI staining.

Similar articles

Cited by

References

    1. Blum JS, Wearsch PA, Cresswell P. Pathways of antigen processing. Annual Review of Immunology. 2013;31:443–447. - PMC - PubMed
    1. Mitchison NA. T-cell-B-cell cooperation. Nature Reviews Immunology. 2004;4:308–312. - PubMed
    1. Singer JB, Lewitzky S, Leroy E, et al. A genome-wide study identifies HLA alleles associated with lumiracoxib-related liver injury. Nature Genetics. 2010;42(8):711–714. - PubMed
    1. Geusens P, Lems W. Efficacy and tolerability of lumiracoxib, a highly selective cyclo-oxygenase-2 (COX2) inhibitor, in the management of pain and osteoarthritis. Therapeutics and Clinical Risk Management. 2008;4(2):337–344. - PMC - PubMed
    1. Laine L, White WB, Rostom A, Hochberg M. COX-2 selective inhibitors in the treatment of osteoarthritis. Seminars in Arthritis and Rheumatism. 2008;38(3):165–187. - PubMed

LinkOut - more resources