. 2013:2013:634351.
doi: 10.1155/2013/634351. Epub 2013 Apr 24.

Multimodal imaging in hereditary retinal diseases

Affiliations

Multimodal imaging in hereditary retinal diseases

Francesco Pichi et al. J Ophthalmol. 2013.

Abstract

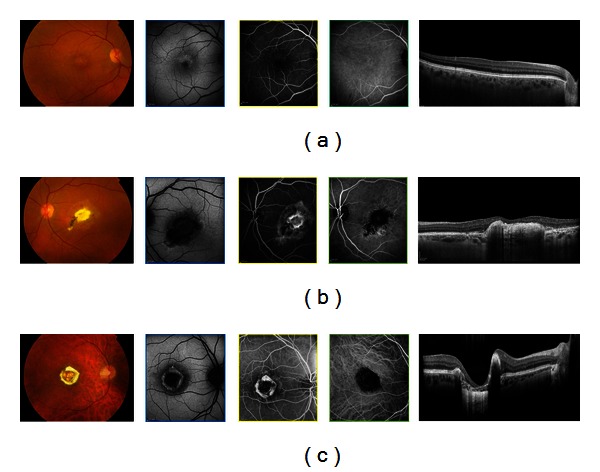
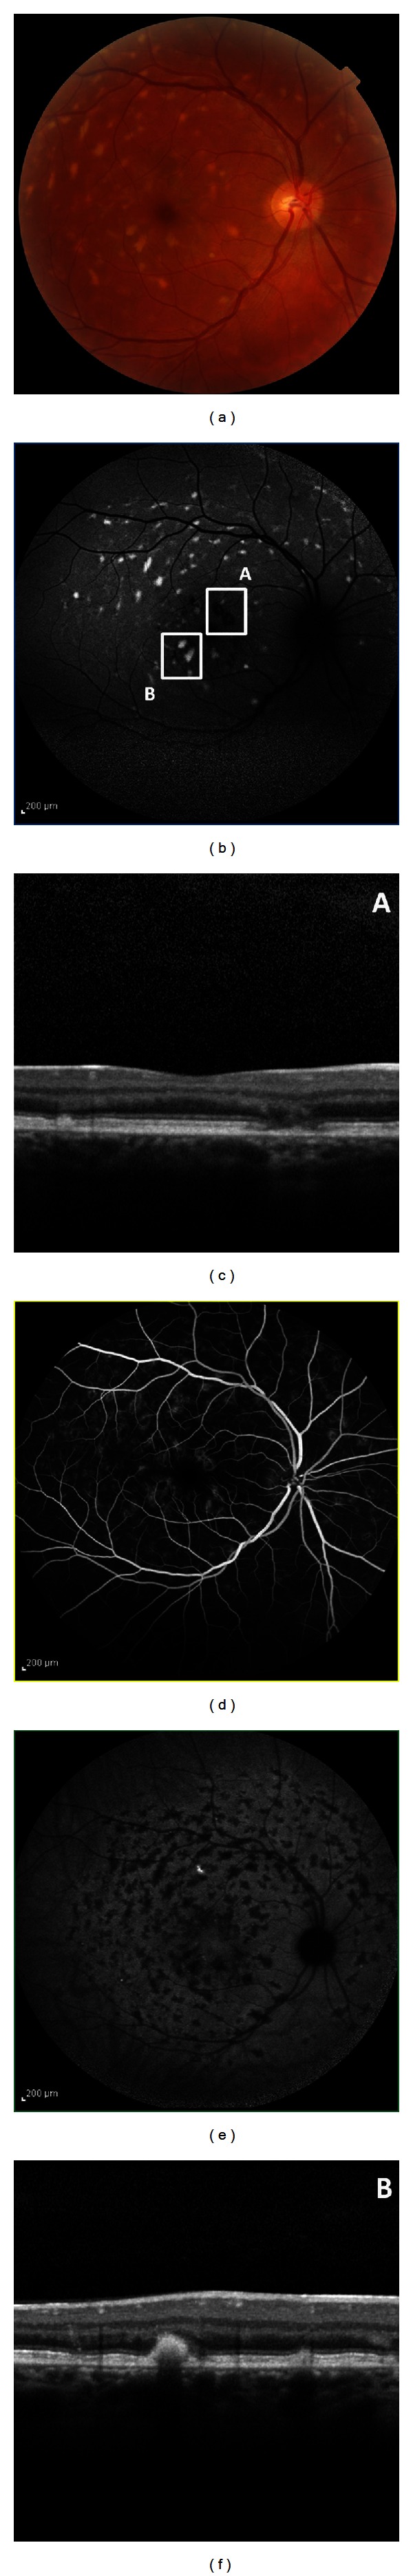
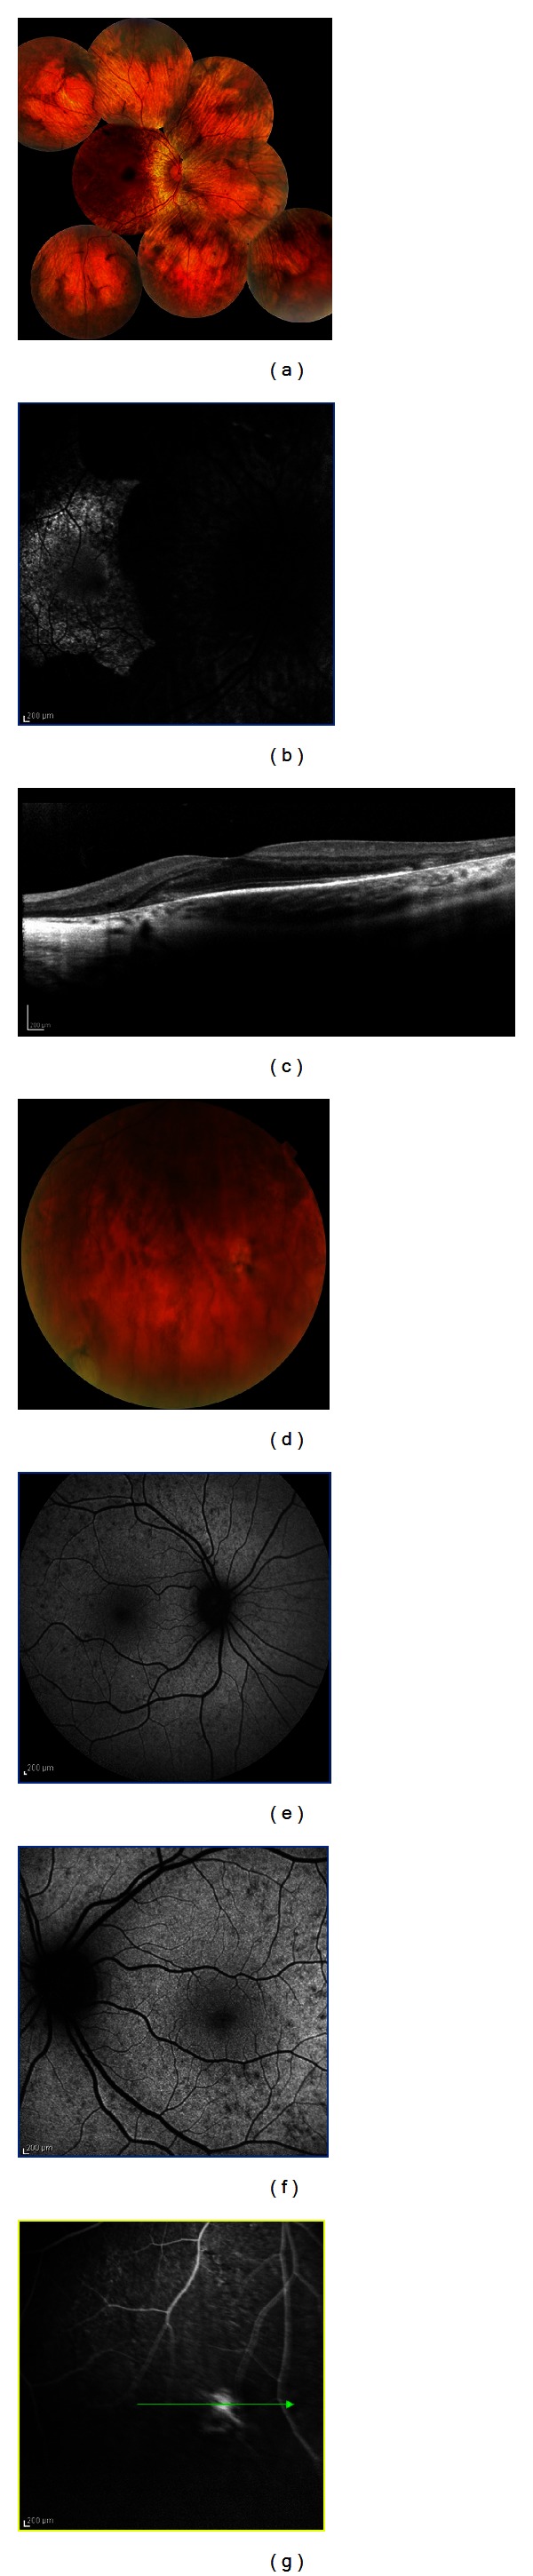
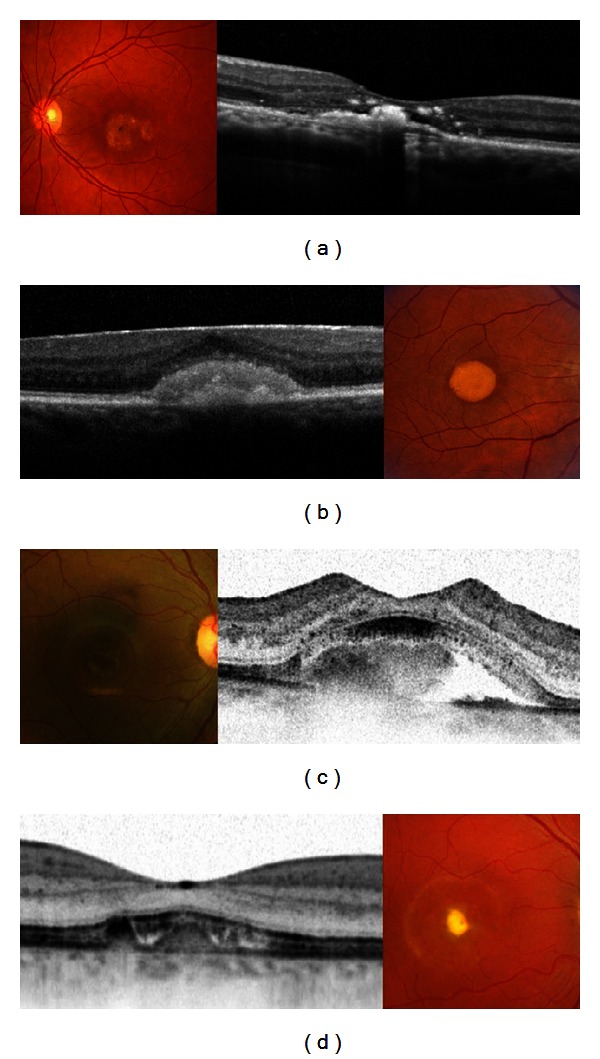
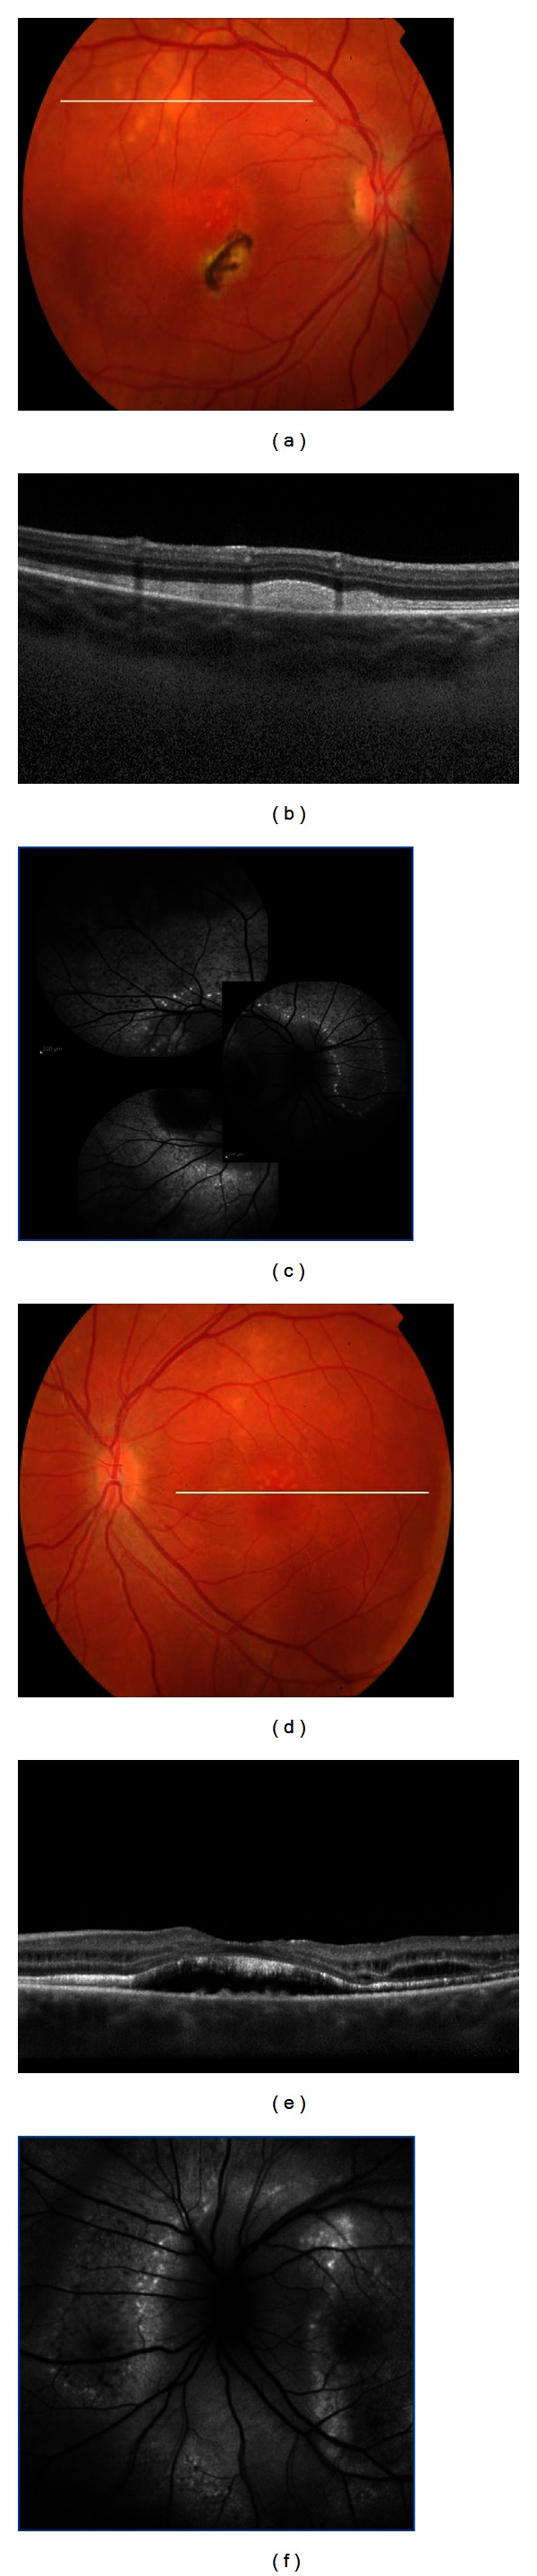
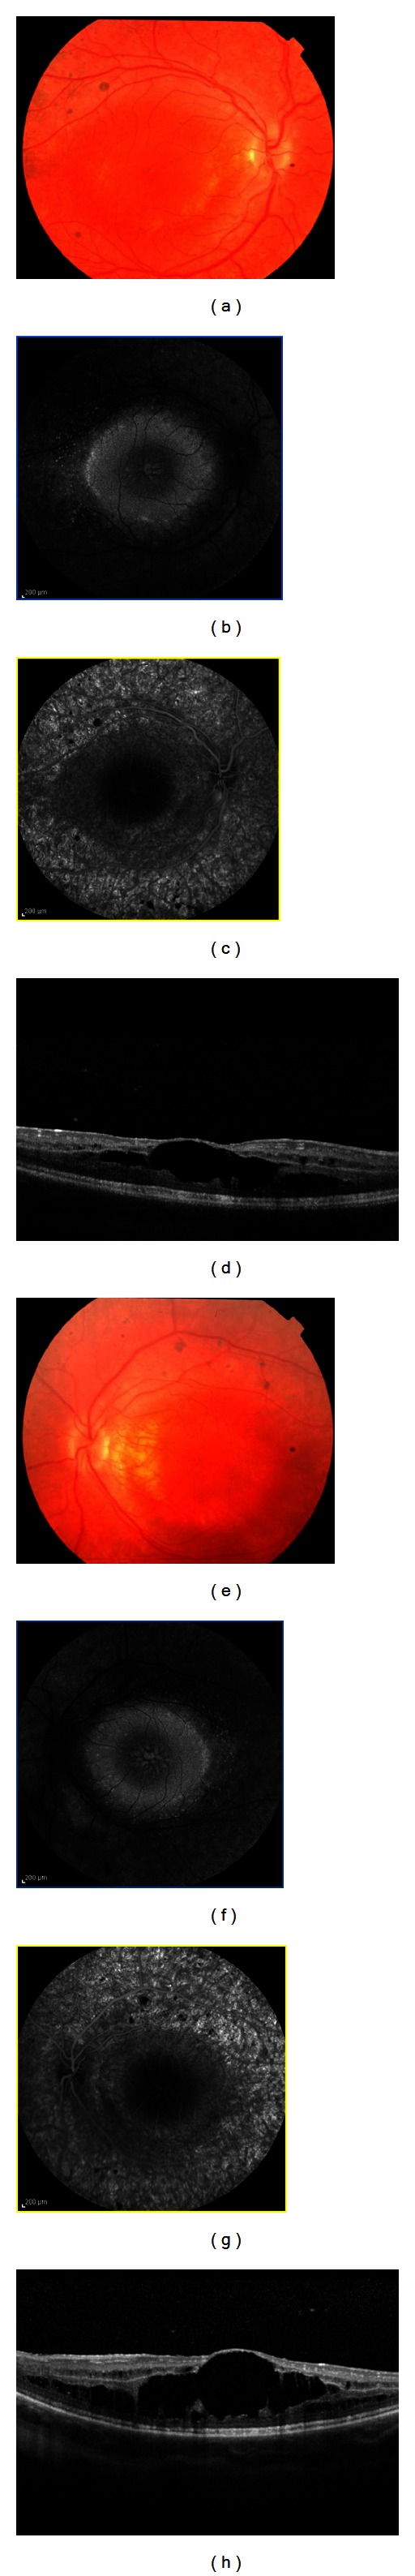
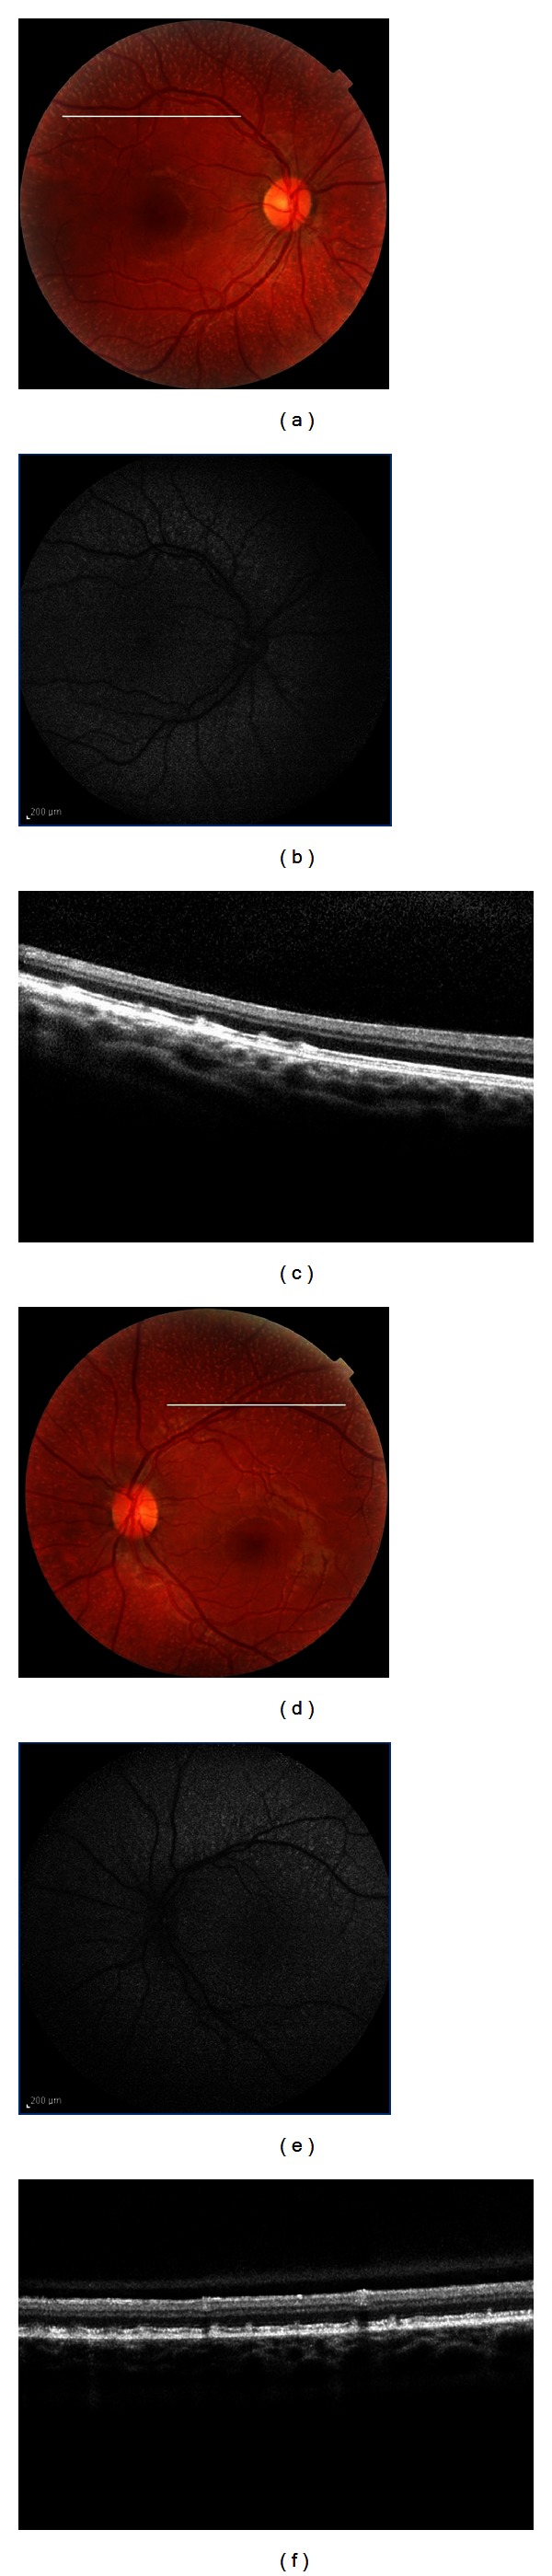
Introduction. In this retrospective study we evaluated the multimodal visualization of retinal genetic diseases to better understand their natural course. Material and Methods. We reviewed the charts of 70 consecutive patients with different genetic retinal pathologies who had previously undergone multimodal imaging analyses. Genomic DNA was extracted from peripheral blood and genotyped at the known locus for the different diseases. Results. The medical records of 3 families of a 4-generation pedigree affected by North Carolina macular dystrophy were reviewed. A total of 8 patients with Stargardt disease were evaluated for their two main defining clinical characteristics, yellow subretinal flecks and central atrophy. Nine male patients with a previous diagnosis of choroideremia and eleven female carriers were evaluated. Fourteen patients with Best vitelliform macular dystrophy and 6 family members with autosomal recessive bestrophinopathy were included. Seven patients with enhanced s-cone syndrome were ascertained. Lastly, we included 3 unrelated patients with fundus albipunctatus. Conclusions. In hereditary retinal diseases, clinical examination is often not sufficient for evaluating the patient's condition. Retinal imaging then becomes important in making the diagnosis, in monitoring the progression of disease, and as a surrogate outcome measure of the efficacy of an intervention.


Figures

Figure 1
Figure 1
Fundus photographs of affected patients with North Carolina macular dystrophy, showing fine, confluent drusen in the macula (grade I), a subretinal scar due to a prior choroidal neovascularization (Grade II), and a macular caldera (Grade III). In Grade I lesion, autofluorescence shows marked hyperautofluorescence of the bright drusen-like elements. SD-OCT shows a normal anatomy of the inner retina; the photoreceptor-retinal pigment epithelium complex appears normal, and the drusen-like lesions are not detectable. In Grade II lesion, SD-OCT shows increased reflectivity consistent with subretinal fibrosis or gliosis. In the Grade III lesion, fundus autofluorescence demonstrates central hypoautofluorescence, surrounded by normal appearing retina tissue and preserved foveal tissue. There is a hyperautofluorescent perimeter surrounding the edges of the lesion, possibly indicative of metabolic byproduct deposition. SD-OCT demonstrates a normal hyperreflective IS/OS photoreceptor junction with abrupt attenuation of outer retinal structures and RPE absence within the lesion.
Figure 2
Figure 2
Color photograph shows macular atrophy and retinal flecks in a Stargardt patient. OCT scans are illustrated by the arrows 1 and 2. The autofluorescent frame clearly delineates the retinal flecks. Thin and open arrows point to two of the flecks, respectively, crossed by scans 1 and 2. Fluorescein angiography shows the dark choroid appearance, and the hypofluorescent flecks are hardly discernable in the hyperfluorescent background because of RPE changes. On ICG, late phase (30 min), the hypofluorescent lesions appear more numerous than the autofluorescent flecks, and there is sparing of the peripapillary area. The SD-OCT scan in square A shows a small hyperreflective lesion located at the inner part of the RPE layer, called type 1 deposit, and macular atrophy. The SD-OCT scan in square B shows a small hyperreflective linear lesion located at the level of the outer nuclear layer and clearly distinguished from the RPE layer, called type 2 deposit.
Figure 3
Figure 3
Fundus photograph of a male patient affected by choroideremia shows midperipheral RPE atrophy spreading peripherally with visualization of coursing large choroidal vessels and sparing of the fovea. Fundus autofluorescence demonstrates an hyperautofluorescent stellate preservation of the posterior pole. Spectral-domain OCT scans show diffuse choroidal atrophy and loss of the IS/OS junction, which is intact and preserved at the level of the fovea. The boy's mother was a genetically confirmed female carrier: her fundus shows mild, patchy peripheral RPE mottling with a striking speckled pattern in FAF.
Figure 4
Figure 4
Spectral domain-OCT scans document the natural evolution of BVMD. Firstly a thicker layer between the photoreceptors inner/outer segment interface and the underlying RPE (previtelliform stage). The material is subsequently deposited under the neurosensory retina (vitelliform stage) and is sometimes accompanied with a neurosensory detachment (pseudohypopyon stage) secondary to its reabsorption, with abnormalities of the RPE and subsequent thinning of all retinal layers (vitelliruptive and atrophic stage).
Figure 5
Figure 5
Fundus photograph of an autosomal recessive bestrophinopathy shows a well-demarcated area with round yellowish-white deposits at the posterior pole and along the superotemporal arcade; subretinal fibrosis is visible inferior nasal of the fovea. SD-OCT scan illustrates extensive RPE deposits extending to the outer plexiform layer. Fundus autofluorescence imaging displayed marked hyperautofluorescence corresponding to the yellow lesions. Fundus photograph shows a well-demarcated area with round yellowish-white deposits at the posterior pole extending to the superior periphery. SD-OCT scan demonstrates RPE detachment from the photoreceptors. Photoreceptor outer segments are thickened and elongated. Fundus autofluorescence identified additional peripapillary hyperfluorescent deposits not seen on funduscopy.
Figure 6
Figure 6
Color fundus photography of a patient with enhanced s-cone syndrome showing nummular pigmentary clumping at the level of the RPE along the vascular arcades and macular disturbance with subtle pigmentary changes; fundus autofluorescence shows an absence of AF outside the arcades and a ring of increased AF at the posterior pole. Foveal schisis is demonstrated on SD-OCT and confirmed by the absence of leakage on fluorescein angiography.
Figure 7
Figure 7
Fundus photograph of two eyes with fundus albipunctatus shows many small white dots scattered throughout the retina except for the foveal area. Fundus autofluorescence imaging of both eyes produced fuzzy and grainy images, and the margins of the optic nerve head and blood vessels are blurred. On SD-OCT, focal thickening centered in the photoreceptor OS and extending forward close to the outer limiting membrane and backward to the outer aspect of the RPE is seen corresponding to the multiple discrete albipunctate dots. These lesions seem to bulge their outer and inner boundaries. There was a reduced visualization of the photoreceptor outer tips.

References

    1. Delori FC, Dorey CK, Staurenghi G, Arend O, Goger DG, Weiter JJ. In vivo fluorescence of the ocular fundus exhibits retinal pigment epithelium lipofuscin characteristics. Investigative Ophthalmology and Visual Science. 1995;36(3):718–729. - PubMed
    1. Schmitz-Valckenberg S, Holz FG, Bird AC, Spaide RF. Fundus autofluorescence imaging: review and perspectives. Retina. 2008;28(3):385–409. - PubMed
    1. Pichi F, Morara M, Veronese C, Lembo A, Nucci P, Ciardella AP. Perivenular whitening in central vein occlusion described by fundus autofluorescence and spectral domain optical coherence tomography. Retina. 2012;32(7):1438–1439. - PubMed
    1. Elsner AE, Burns SA, Weiter JJ, Delori FC. Infrared imaging of sub-retinal structures in the human ocular fundus. Vision Research. 1996;36(1):191–205. - PubMed
    1. Clark A, Balducci N, Pichi F, et al. Swelling of the arcuate nerve fiber layer after internal limiting membrane peeling. Retina. 2012;32(8):1608–1613. - PubMed