. 2013 May 27;201(5):725-40.
doi: 10.1083/jcb.201206063.

Cryo-electron tomography reveals a critical role of RIM1α in synaptic vesicle tethering

Affiliations

Cryo-electron tomography reveals a critical role of RIM1α in synaptic vesicle tethering

Rubén Fernández-Busnadiego et al. J Cell Biol. .

Abstract

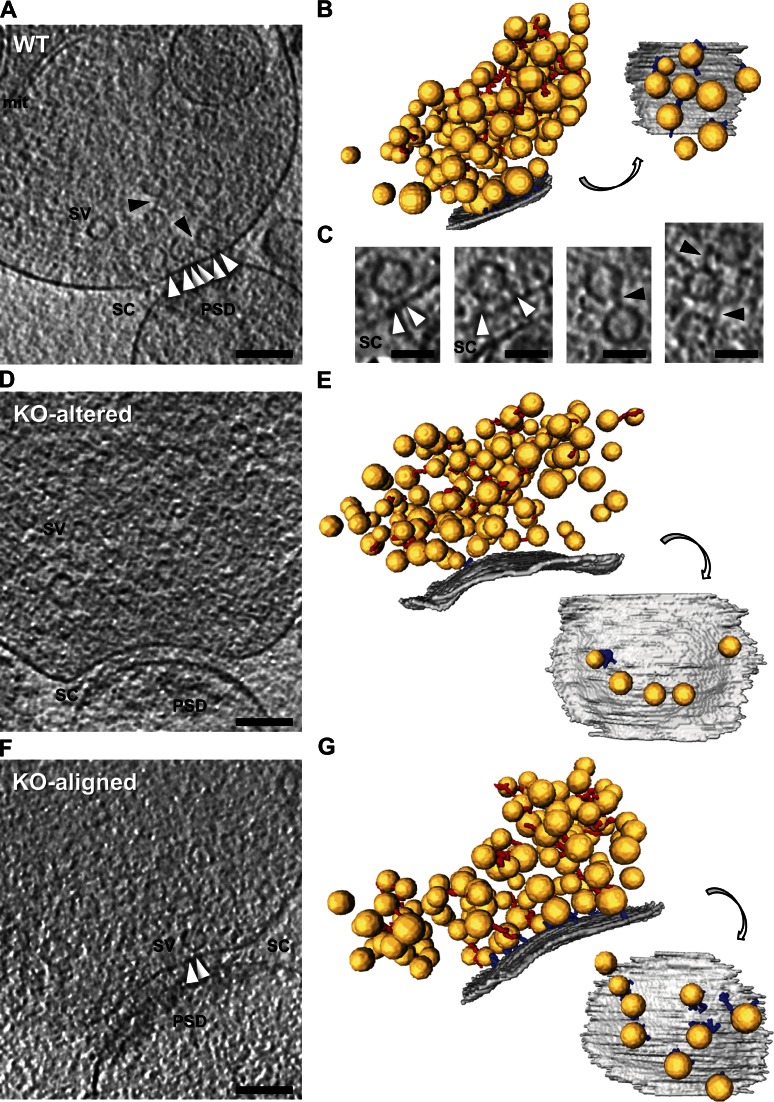
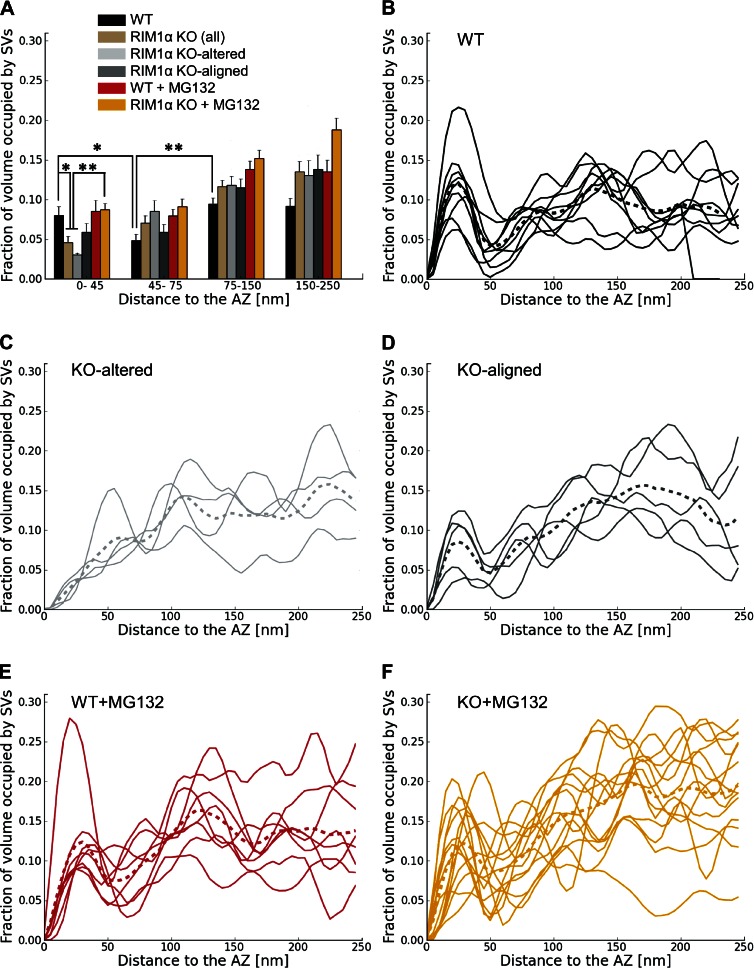
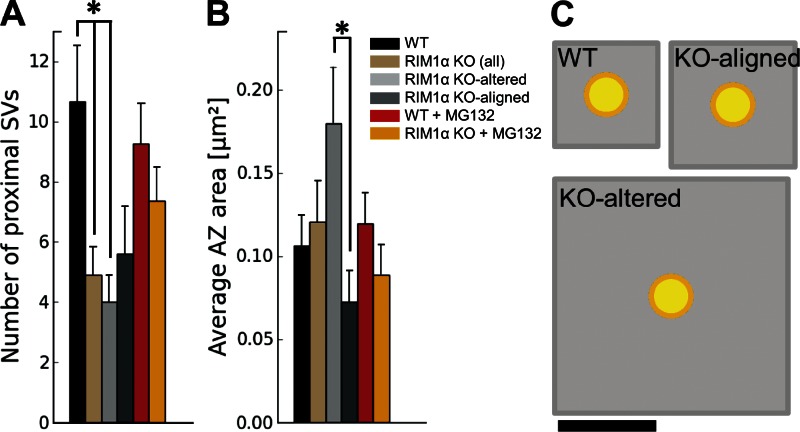
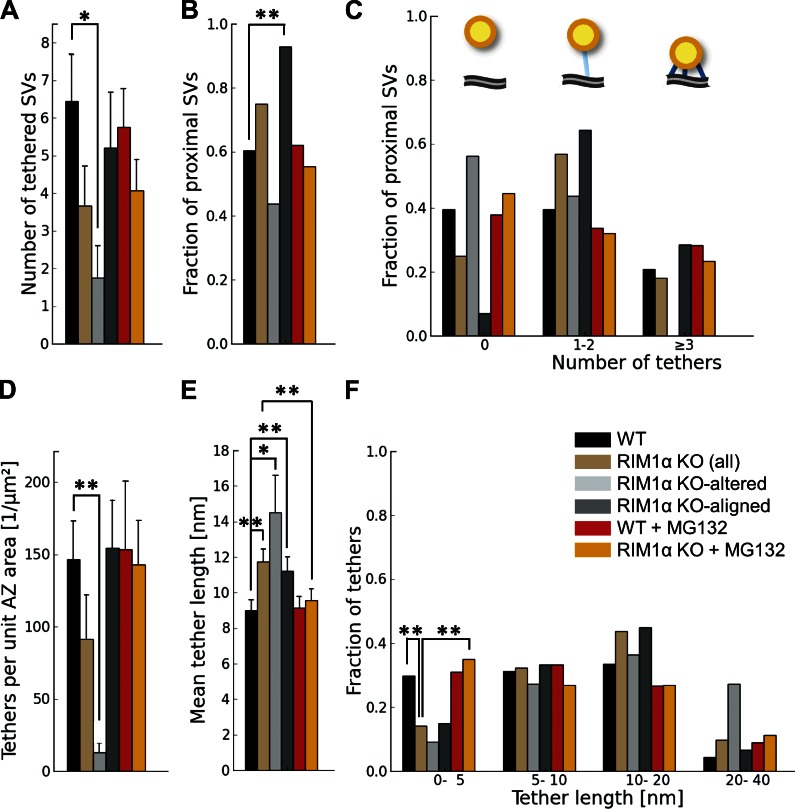
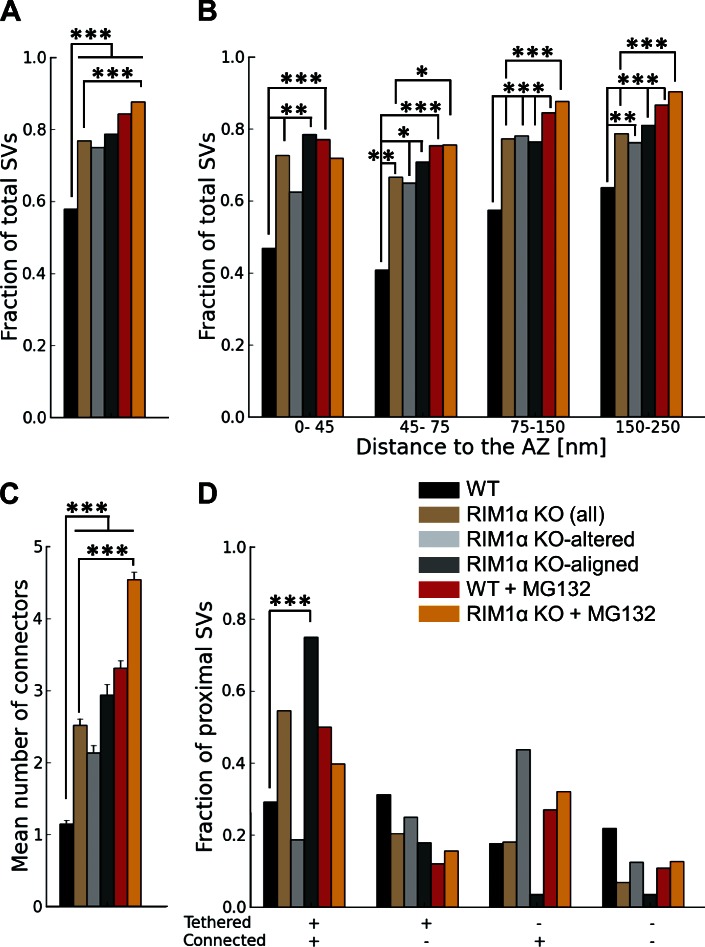
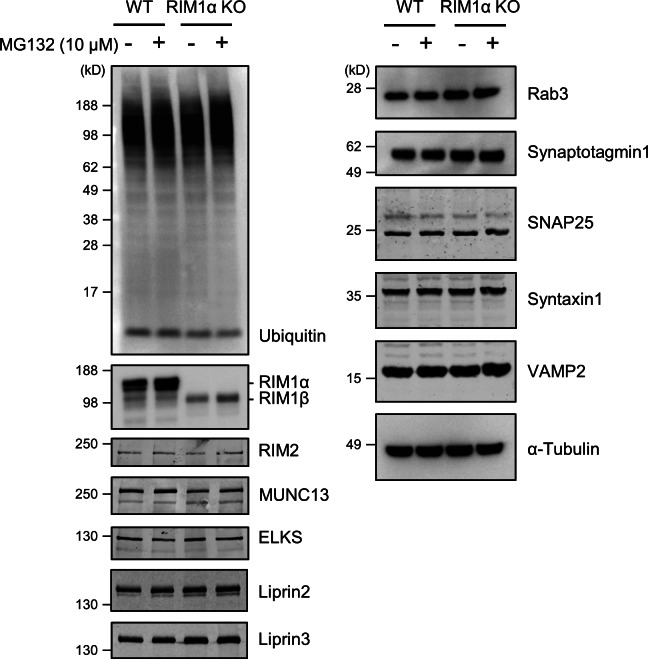
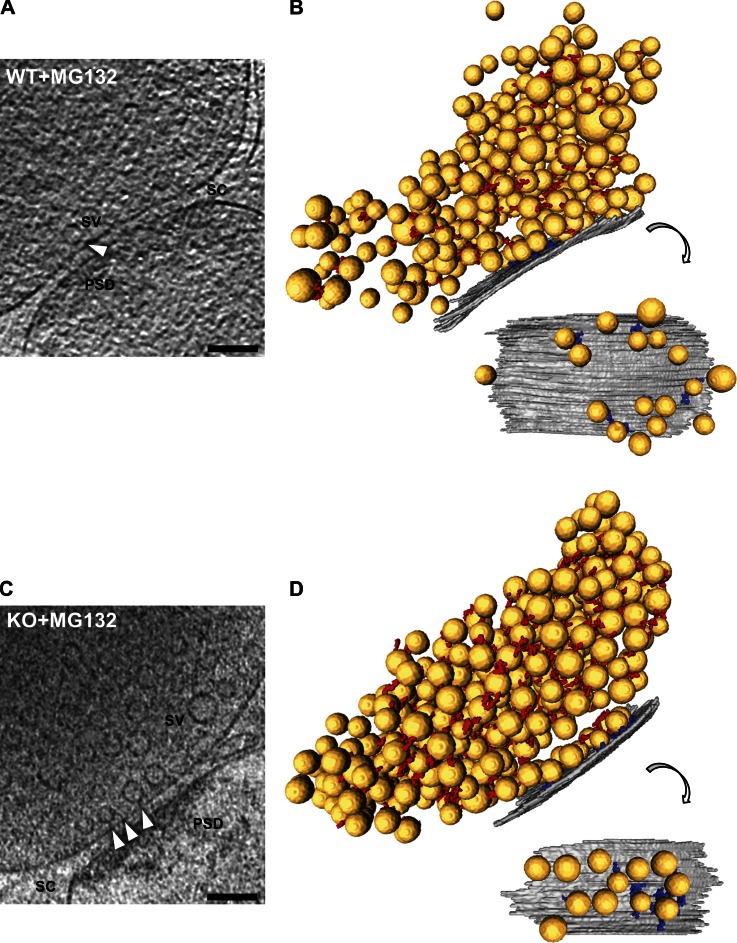
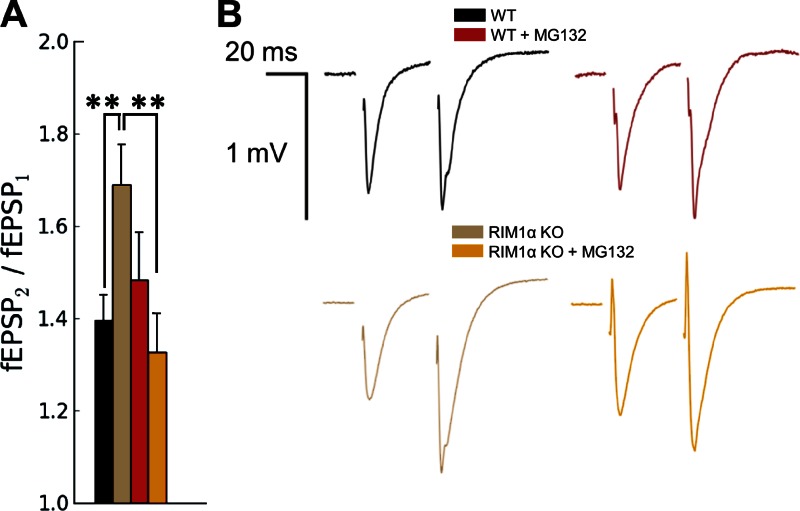
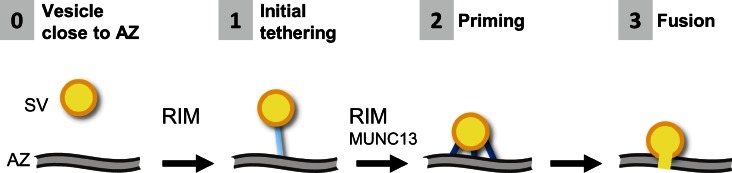
Synaptic vesicles are embedded in a complex filamentous network at the presynaptic terminal. Before fusion, vesicles are linked to the active zone (AZ) by short filaments (tethers). The identity of the molecules that form and regulate tethers remains unknown, but Rab3-interacting molecule (RIM) is a prominent candidate, given its central role in AZ organization. In this paper, we analyzed presynaptic architecture of RIM1α knockout (KO) mice by cryo-electron tomography. In stark contrast to previous work on dehydrated, chemically fixed samples, our data show significant alterations in vesicle distribution and AZ tethering that could provide a structural basis for the functional deficits of RIM1α KO synapses. Proteasome inhibition reversed these structural defects, suggesting a functional recovery confirmed by electrophysiological recordings. Altogether, our results not only point to the ubiquitin-proteasome system as an important regulator of presynaptic architecture and function but also show that the tethering machinery plays a critical role in exocytosis, converging into a structural model of synaptic vesicle priming by RIM1α.


Figures

Figure 1.
Figure 1.
Morphology of WT and RIM1α KO synapses by cryo-ET. In unstained, vitrified frozen-hydrated mammalian synapses, the presynaptic cytomatrix mainly consists of filaments shorter than 40 nm linking vesicles to each other (connectors) or to the AZ (tethers). (A, D and F) Tomographic slices of WT (A), RIM1α KO-altered (D), and RIM1α KO-aligned (F) synapses. mit, mitochondrion; PSD, postsynaptic density; SC, synaptic cleft; SV, synaptic vesicle. Bars, 100 nm. B, E, and G show corresponding 3D renderings of all vesicles within 250 nm from the AZ (left) and of the AZ and proximal vesicles seen from the cytoplasmic side (right). AZ (gray), synaptic vesicles (yellow), tethers (blue), connectors (red) are shown. For scale reference, mean vesicle diameter was 40.1 ± 5.4 nm (mean ± SD; no scale bars are shown because the image is rendered with 3D perspective). RIM1α KO-altered synapses showed reduced number of proximal vesicles and vesicle tethering to the AZ. (C) Magnified views of connectors (black arrowheads) and tethers (white arrowheads). Bars, 50 nm. Tomographic slices are 5.4 nm thick. Video 1, Video 2, and Video 3 are related.
Figure 2.
Figure 2.
Synaptic vesicle concentration. For vesicles within 250 nm from the AZ, shown as the fraction of cytoplasmic volume occupied by vesicles, according to their distance to the AZ. (A) Mean vesicle concentration versus distance to the AZ. Error bars show SEMs. Proximal vesicle concentration was significantly reduced in RIM1α KO. (B–F) Individual vesicle concentration profiles for all synapses in WT, KO-altered, KO-aligned, WT + MG132, and KO + MG132 categories, respectively. Thicker dotted profiles represent means. Confidence values: *, P < 0.05; **, P < 0.01. Whereas all WT synapses showed a characteristic profile, RIM1α KO synapses were classified in two subpopulations (KO altered and KO aligned) according to the existence of vesicle concentration maxima within the proximal zone. In contrast, most MG132-treated RIM1α KO synapses showed a concentration profile comparable to WT. The numbers of animals, synapses, and vesicles analyzed for each category are shown in Table S1. SV, synaptic vesicle.
Figure 3.
Figure 3.
AZ organization. (A) Number of proximal synaptic vesicles (SV; within 45 nm from the AZ) per synapse, which was significantly reduced in RIM1α KO synapses. (B) Average AZ area. A and B show mean values and SEMs (error bars). Confidence value: *, P < 0.05. The numbers of animals, synapses, and vesicles analyzed for each category are shown in Table S1. (C) Quantitative representation of AZ area (gray) per proximal vesicle (yellow), calculated as the total AZ area (B) divided by the number of proximal vesicles (A). Bar, 100 nm.
Figure 4.
Figure 4.
Synaptic vesicle tethers to the AZ. For proximal vesicles (within 45 nm from the AZ, as virtually no vesicles were tethered in more distal areas). (A) Number of tethered vesicles per synapse, which was strongly reduced in RIM1α KO-altered synapses. (B) Fraction of proximal vesicles tethered to the AZ. (C) Histogram of number of tethers per proximal vesicle. Note that no vesicles with more than two tethers were found in KO-altered synapses. (top) The cartoon represents the bins of the histogram: nontethered vesicles (left), vesicles with one to two tethers (middle), and vesicles with multiple tethers (right). AZ (gray), proximal vesicles (yellow), and tethers (blue) are shown. (D) Number of tethers per AZ unit area. (E) Tether length. (F) Histogram of tether lengths. Short tether formation was impaired in RIM1α KO synapses. A, D, and E show mean values and SEMs (error bars). B, C, and F show number of occurrences (consequently no error bars are displayed). Confidence values: *, P < 0.05; **, P < 0.01. The numbers of animals, synapses, vesicles, and tethers analyzed for each category are shown in Table S1. SV, synaptic vesicle.
Figure 5.
Figure 5.
Synaptic vesicle connectors for vesicles within 250 nm from the AZ. Connectivity increased both in WT and RIM1a KO under MG132 treatment. (A) Fraction of connected vesicles. (B) Fraction of connected vesicles versus distance to the AZ. (C) Mean number of connectors per vesicle. (D) Fraction of vesicles as a function of tethering and connectivity. C shows mean values and SEMs (error bars). A, B, and D show number of occurrences (consequently no error bars are displayed). Confidence values: *, P < 0.05; **, P < 0.01; ***, P < 0.001. The numbers of animals, synapses, vesicles, and connectors analyzed for each category are shown in Table S1. SV, synaptic vesicle.
Figure 6.
Figure 6.
Western blot analysis for ubiquitin and various presynaptic proteins. The double band detected for RIM1α corresponds to splice variants (see, e.g., Fig. 1 of Kaeser et al., 2008). MG132 induced an increase in the levels of RIM1α (WT), RIM1β (KO), and MUNC13 (WT and KO) and a smaller increase in RIM2 (KO) but not in other presynaptic proteins. Sample sizes (pairs of WT and KO littermates) are as follows: seven (RIM1 and MUNC13), six (RIM2), and three to four (ELKS, Liprin2, Liprin3, Rab3, synaptotagmin1, syntaxin1, SNAP25, VAMP2, and ubiquitin).
Figure 7.
Figure 7.
Morphology of MG132-treated WT and RIM1α KO synapses by cryo-ET. (A and C) Tomographic slices of MG132-treated WT (A) and RIM1α KO (C) synapses. PSD, postsynaptic density; SC, synaptic cleft; SV, synaptic vesicle; white arrowheads, tethers. Tomographic slices are 5.4 nm thick. Bars, 100 nm. B and D show corresponding 3D renderings of all vesicles analyzed (left) and of the AZ and proximal vesicles seen from the cytoplasmic side (right). AZ (gray), synaptic vesicles (yellow), tethers (blue), and connectors (red) are shown. For scale reference, mean vesicle diameter was 40.1 ± 5.4 nm (mean ± SD; no scale bars are shown because the image is rendered with 3D perspective). MG132-treated WT and RIM1α KO synapses were comparable in terms of proximal vesicle concentration and vesicle tethering to the AZ.
Figure 8.
Figure 8.
Excitatory synaptic responses to paired-pulse stimulation in WT and RIM1α KO mice in the absence and presence of MG132. (A) PPF (fEPSP2/fEPSP1) recorded in stratum radiatum of CA1. The graph shows mean values and SEMs (error bars). Confidence values: **, P < 0.01. Compared with WT mice, RIM1α KO mice showed an increase in PPF that was reversed by MG132 treatment. (B) Representative traces. Sample sizes are as follows (slices/animals): WT, 14/4; WT + MG132, 16/4; RIM1α KO, 14/4; and RIM1α KO + MG132, 13/4.
Figure 9.
Figure 9.
Model for RIM-mediated synaptic vesicle priming. In WT terminals, vesicles (synaptic vesicle [SV]) that are close to the AZ (0) are first linked to the AZ (1) by one or few tethers (blue rods) in a RIM-dependent process. Likely by the action of RIM and MUNC13, vesicles progressively acquire additional shorter tethers, thereby reducing the distance between vesicle and AZ. Vesicles with multiple tethers are primed for release (2), and primed vesicles can fuse upon Ca2+ influx (3).

References

    1. Andrews-Zwilling Y.S., Kawabe H., Reim K., Varoqueaux F., Brose N. 2006. Binding to Rab3A-interacting molecule RIM regulates the presynaptic recruitment of Munc13-1 and ubMunc13-2. J. Biol. Chem. 281:19720–19731 10.1074/jbc.M601421200 - DOI - PubMed
    1. Aravamudan B., Broadie K. 2003. Synaptic Drosophila UNC-13 is regulated by antagonistic G-protein pathways via a proteasome-dependent degradation mechanism. J. Neurobiol. 54:417–438 10.1002/neu.10142 - DOI - PubMed
    1. Bingol B., Sheng M. 2011. Deconstruction for reconstruction: the role of proteolysis in neural plasticity and disease. Neuron. 69:22–32 10.1016/j.neuron.2010.11.006 - DOI - PubMed
    1. Blundell J., Kaeser P.S., Südhof T.C., Powell C.M. 2010. RIM1α and interacting proteins involved in presynaptic plasticity mediate prepulse inhibition and additional behaviors linked to schizophrenia. J. Neurosci. 30:5326–5333 10.1523/JNEUROSCI.0328-10.2010 - DOI - PMC - PubMed
    1. Bolte S., Cordelières F.P. 2006. A guided tour into subcellular colocalization analysis in light microscopy. J. Microsc. 224:213–232 10.1111/j.1365-2818.2006.01706.x - DOI - PubMed

Publication types

MeSH terms

Substances