. 2013 May 27;201(5):759-76.
doi: 10.1083/jcb.201212100.

The hypoxia factor Hif-1α controls neural crest chemotaxis and epithelial to mesenchymal transition

Affiliations

The hypoxia factor Hif-1α controls neural crest chemotaxis and epithelial to mesenchymal transition

Elias H Barriga et al. J Cell Biol. .

Abstract

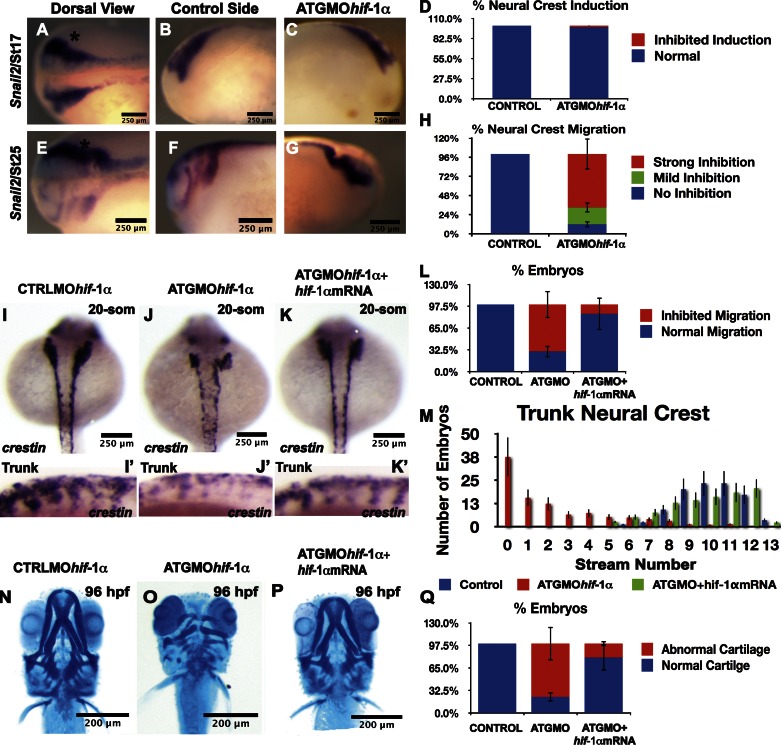
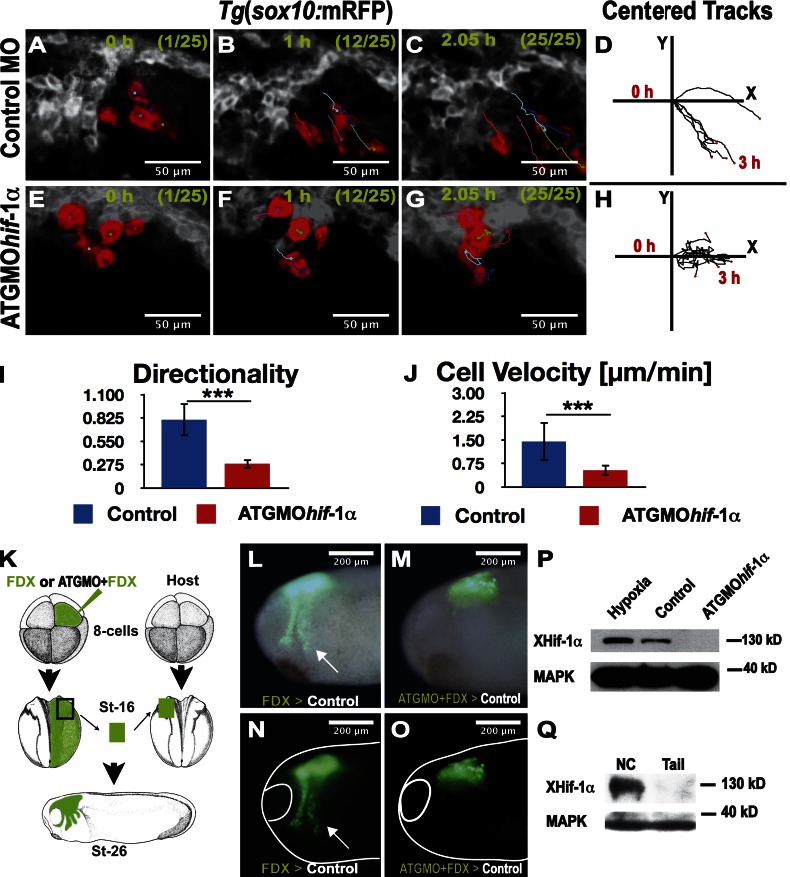
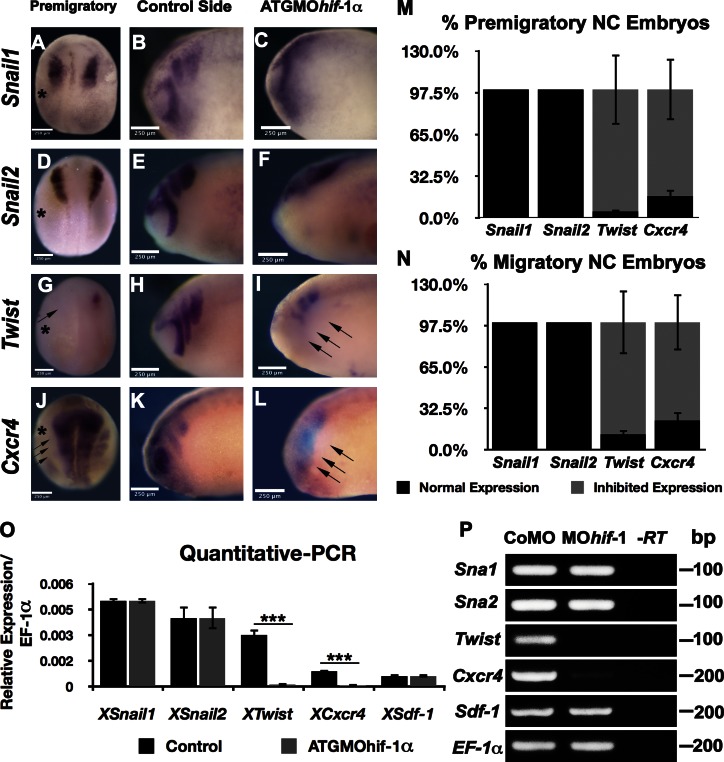
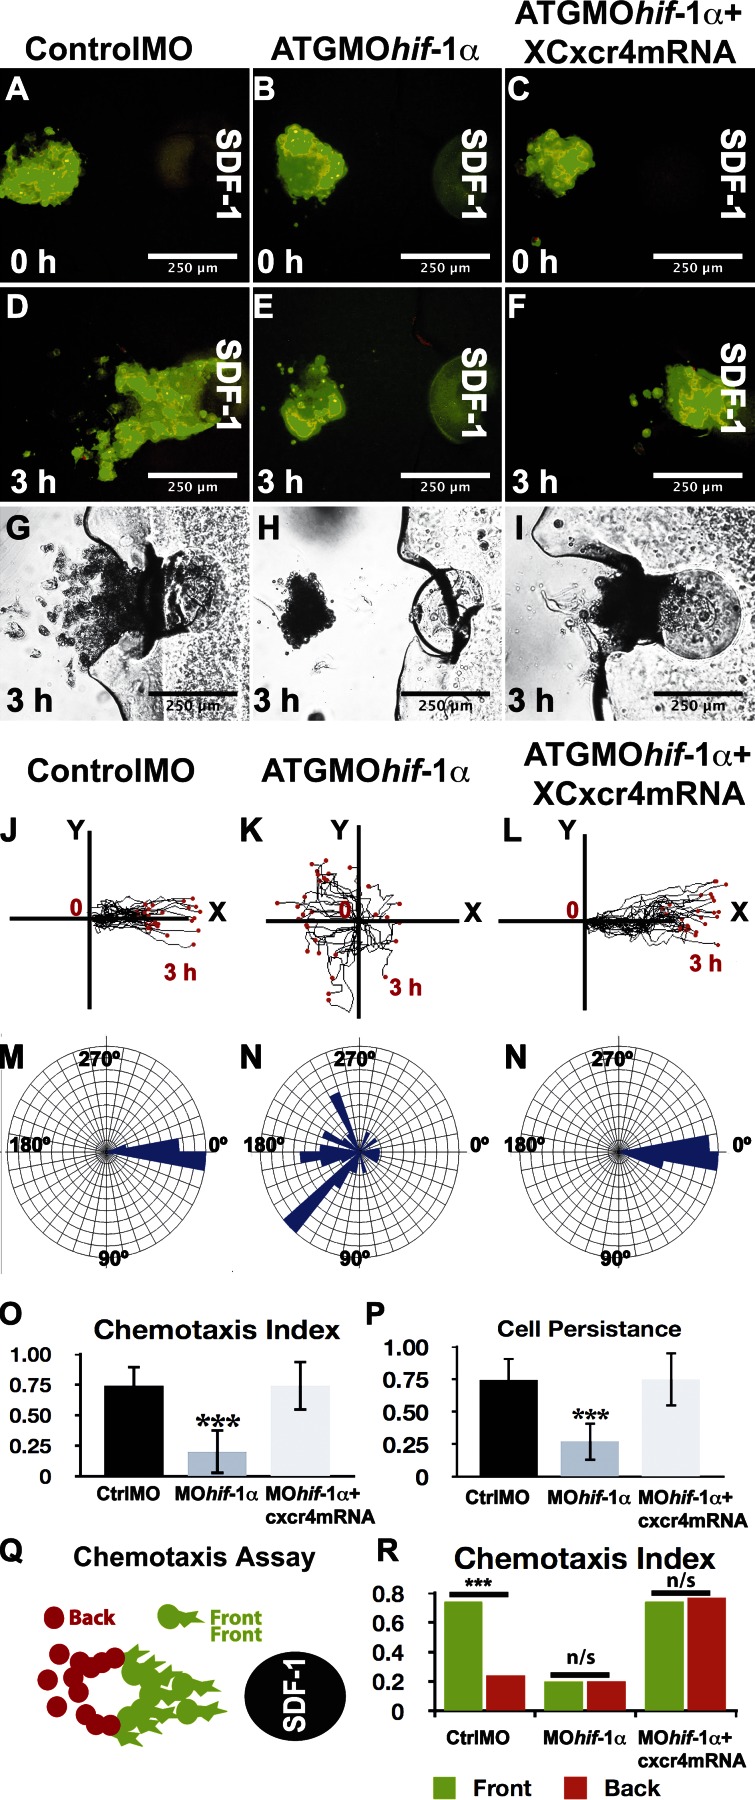
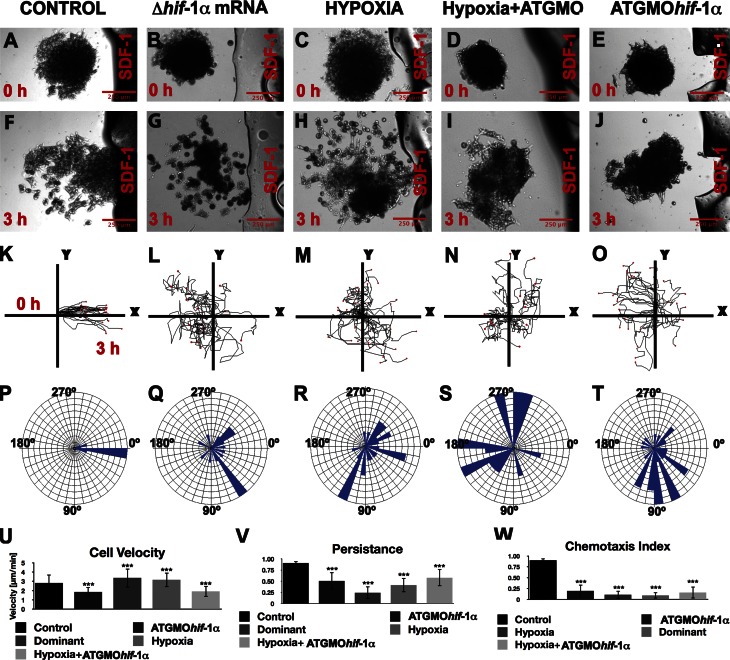
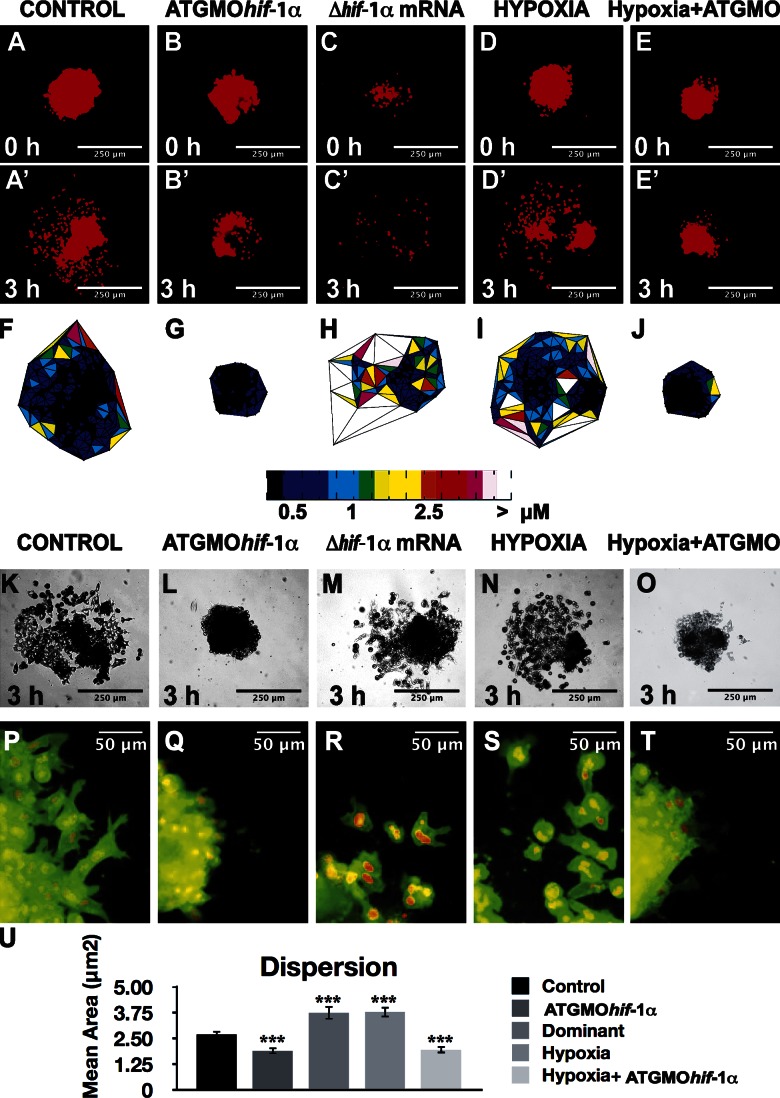
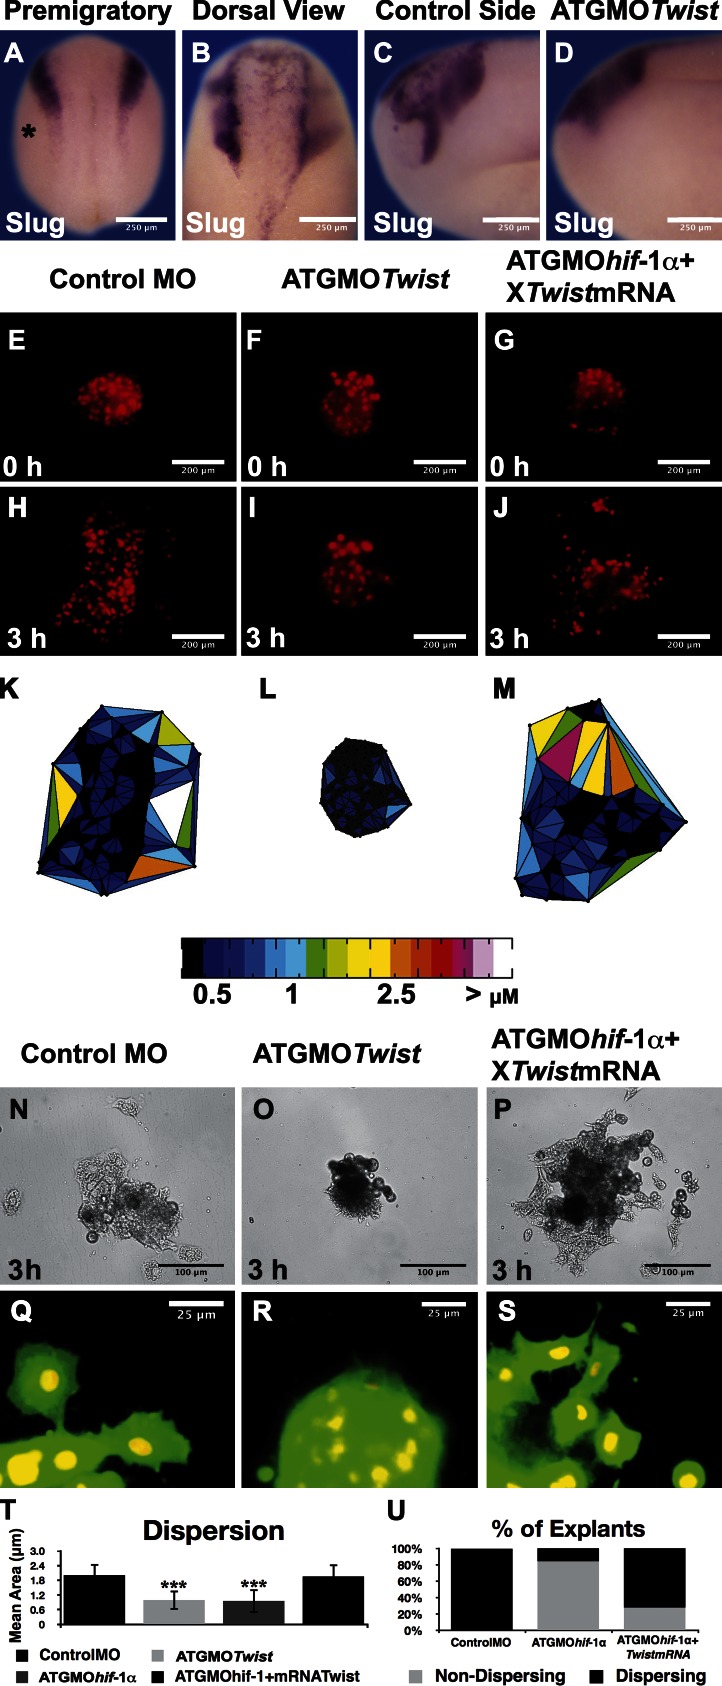
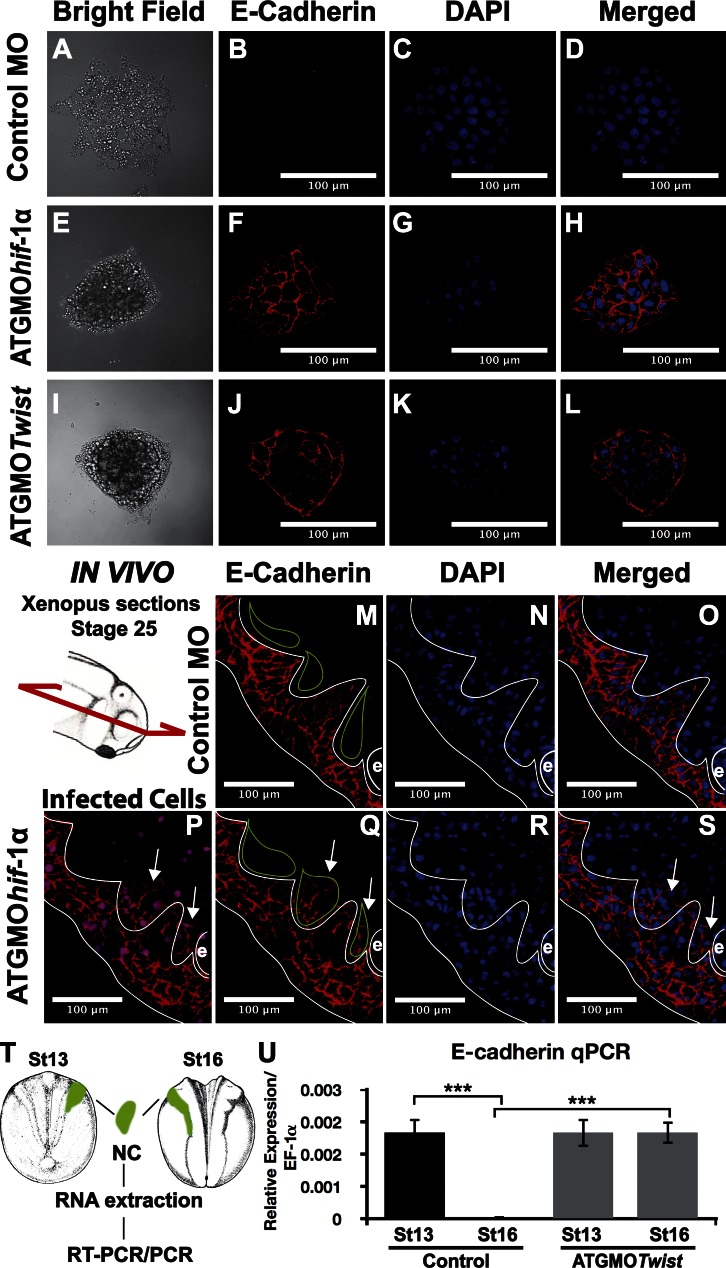
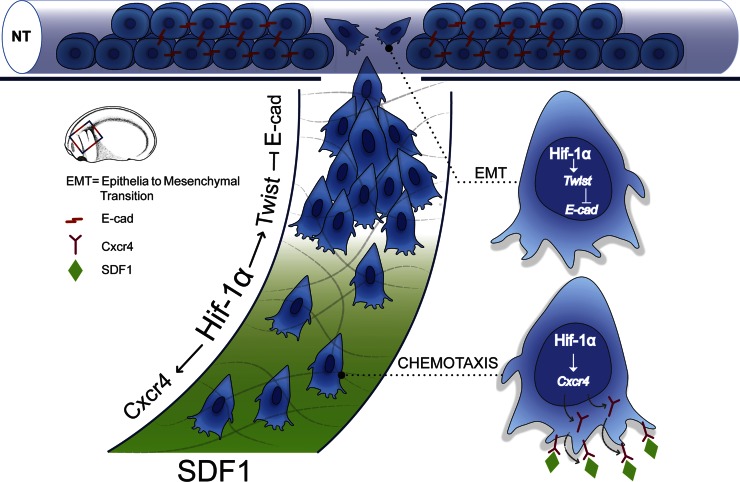
One of the most important mechanisms that promotes metastasis is the stabilization of Hif-1 (hypoxia-inducible transcription factor 1). We decided to test whether Hif-1α also was required for early embryonic development. We focused our attention on the development of the neural crest, a highly migratory embryonic cell population whose behavior has been likened to cancer metastasis. Inhibition of Hif-1α by antisense morpholinos in Xenopus laevis or zebrafish embryos led to complete inhibition of neural crest migration. We show that Hif-1α controls the expression of Twist, which in turn represses E-cadherin during epithelial to mesenchymal transition (EMT) of neural crest cells. Thus, Hif-1α allows cells to initiate migration by promoting the release of cell-cell adhesions. Additionally, Hif-1α controls chemotaxis toward the chemokine SDF-1 by regulating expression of its receptor Cxcr4. Our results point to Hif-1α as a novel and key regulator that integrates EMT and chemotaxis during migration of neural crest cells.


Figures

Figure 1.
Figure 1.
Hif-1α is required for neural crest migration. (A–Q) Xenopus (A–H) and zebrafish (I–Q) embryos were injected with antisense MOs as indicated in the figure, and the expression of the neural crest markers Snail2 (A–H) or crestin (I–M) was analyzed. Asterisks show the injected side. (A–D) No effect of ATGMOhif- on neural crest induction. (E–H) Strong effect of ATGMOhif- on neural crest migration. (I–J′) Dorsal (I and J) or lateral (I′ and J′) view of zebrafish embryos. (J) Note that in ATGMOhif-–injected embryos, neural crests are present around to the dorsal midline. (L) Percentage of embryos with the described phenotype. (M) The number of neural crest streams was counted by analyzing the expression of crestin for each treatment. (K, K′, and M) Note that the number of streams is reduced with the ATGMOhif-1α but rescued by the coinjection of Hif-1α mRNA. (N–Q) Analysis of cartilage development in zebrafish embryos. The bars in D, H, L, M, and Q histograms represent the standard deviations of three independent experiments, with ∼40 embryos used in each case. som, somite.
Figure 2.
Figure 2.
Hif-1α is required cell autonomously for neural crest migration. (A–H) Frames of a time-lapse video (Video 1) of zebrafish embryos Tg(sox10:mRFP). Leader cells are shown pseudocolored in red for embryos injected with a control MO (A–C) or an ATGMOhif-1α (E–G). (D and H) Centered tracks of leader cells. (I and J) Analysis of cell directionality and velocity of leader cells under indicated conditions. Errors bars represent standard deviation of three independent experiments, with a minimal of 20 embryos in each case. ***, P < 0.005. (K–O) Xenopus graft experiments. (K) FDX/MOs were injected into the ectoderm of blastula embryos. At early neurula stages (St), the injected neural crest was grafted into noninjected embryos, and neural crest migration was analyzed in vivo. (L and N) Normal neural crest migration (n = 10, 80% migration). Arrows show migrating neural crest. (M and O) Inhibition of neural crest migration after ATGMOhif-1α injection (n = 10, 20% migration). (P) Western blot of whole neurula Xenopus embryos, under the indicated conditions. (Q) Western blot of cephalic Xenopus regions enriched in neural crest cells versus tail of young tadpoles that contain very few neural crest cells.
Figure 3.
Figure 3.
Twist and Cxcr4, but not Snail1 or Snail2, are Hif-1α targets in the neural crest. (A–L) Xenopus embryos. In situ hybridization for Snail1, Snail2, Twist, and Cxcr4 after ATGMOhif-1α injection. Asterisks show the injected side. (A–F) Snail1 and Snail2 expression. Note that neither Snail1 nor Snail2 are affected by inhibition of Hif-1α, but a clear inhibition of neural crest migration is observed. (G–I) Twist expression is lost after ATGMOhif- injection (arrows). (J–L) Cxcr4 expression. (J) Note that strong expression in the neural plate is not affected, whereas the neural crest expression is visible only in the right (noninjected) side as three masses next to the neural plate. Arrows indicate absence of gene expression in the neural crest at the injected side. (M and N) Quantification of results shown in A–L. Bars represent the standard deviation from three independent experiments, a minimal of 40 embryos was analyzed for each case. (O and P) Quantitative PCR (O) and RT-PCR (P) of neural crest dissected from embryos injected with a control MO or with ATGMOhif-1α genes analyzed as indicated. EF-1α was used as a loading control. Bars represent the standard deviation from three independent experiments. A minimal of 30 embryos was analyzed for each case. ***, P < 0.005.
Figure 4.
Figure 4.
Hif-1α controls chemotaxis in a Cxcr4-dependent manner. Chemotaxis toward a localized source of SDF-1, which is located to the right of each panel, for each treatment as indicated at the top of the figure. (A–C) Time 0. (D–I) 3 h after culture. (A–I) Fluorescent (A–F) and bright-field (G–I) images. (J–L) Tracks of leader migrating cells. Chemotactic cells should move toward the right side of the panel, where SDF-1 is higher. (M and N) Angles of migration for individual cells. (O) Chemotaxis index for leader cells. (P) Persistence. (Q) Leader cells (green) are more efficiently attracted than trailing cells (red). (R) Chemotaxis of leader (green) and trailing (orange) cells under the indicated conditions. Bars represent the standard deviation from three independent experiments, with a minimal of 60 cells analyzed for each treatment. ***, P < 0.005. Ctrl, control.
Figure 5.
Figure 5.
Hif-1α gain of function induces cell dispersion and inhibits chemotaxis. Chemotaxis was analyzed as described in Fig. 4 for each treatment as indicated at the top of the figure. (A–E) Time 0. (F–J) 3 h after culture. (K–O) Tracks of migrating cells. (P–T) Angles of migration for individual cells. (U) Cell velocity. (V) Persistence. (W) Chemotaxis index. Each experiment was performed at least three times, and ∼60 cells were analyzed for each treatment. ***, P < 0.005. Errors bars represent standard deviation.
Figure 6.
Figure 6.
Hif-1α promotes neural crest dispersion. Neural crest cells labeled with nuclear-RFP and membrane-GFP were cultured in vitro for 3 h, and cells dispersion was analyzed. (A–E) Nuclear labeling is shown at time 0 and after 3 h. (F–J) Delaunay triangulation shown for a 3-h time to analyze the distance between neighbor cells. Color coded according to the area of the triangles. (K–O) Bright-field images after the indicate treatments. (P–T) Membrane-GFP merged with nuclear-RFP to observe cell morphology, after the indicated treatments. (P) Quantification of Delaunay triangulation for all the conditions analyzed. ***, P < 0.005. Errors bars represent standard deviation, calculated from three independent experiments, with a minimal of 60 cells for each condition.
Figure 7.
Figure 7.
Hif-1α controls cell dispersion in a Twist-dependent manner. (A–D) In situ hybridization against the neural crest marker Snail2. (A) Injection of ATGMOTwist into the prospective neural crest at the 16- and 32-cell stage embryo does not affect neural crest induction. Asterisk shows the injected side. (B–D) Injection of ATGMOTwist blocks neural crest migration. (E–S) Analysis of dispersion of cultured neural crest cells as described in Fig 6. (E–J) Nuclear labeling is shown at time 0 and after 3 h. (K–M) Delaunay triangulation shown for 3 h time to analyze the distance between neighbor cells. Color coded according to the area of the triangles after the indicate treatments. (N–P) Bright-field images after the indicated treatments. (Q–S) Membrane-GFP merged with nuclear-RFP to observe cell morphology. (T) Quantification of Delaunay triangulation for all the conditions analyzed. ***, P < 0.005. Errors bars represent standard deviation of three independent experiments, with a minimal of 60 cells analyzed for each condition. (U) Percentage of explants exhibiting cell dispersion.
Figure 8.
Figure 8.
Hif-1α/Twist are repressors of E-cadherin in the neural crest. (A–L) Immunofluorescence against E-cadherin performed in neural crest cultured in vitro. (M–S) Histological sections of immunofluorescence against E-cadherin performed in whole embryos. The diagram shows the orientation of the sections. White outlines show epidermis and placodes; green outlines show three streams of cephalic neural crest; e, eye. Red staining shows E-cadherin; blue staining shows DAPI; purple staining in P and S shows cells injected with ATGMOhif-1α. Arrows show neural crest. Note that some of the neural crests injected with the MO show E-cadherin staining (arrows in Q). (T and U) Temporal analysis of E-cadherin expression. Prospective neural crest (stage 13) and premigratory neural crest (stage 16) were dissected, and quantitative PCR was performed for E-cadherin and EF-1α (loading control). Bars represent the standard deviation from three independent experiments. ***, P < 0.005. NC, neural crest; qPCR, quantitative PCR; St, stage.
Figure 9.
Figure 9.
Model of Hif-1 controlling neural crest migration. Neural crest, shown as blue cells, delaminates from the neural tube (NT). Prospective neural crest expresses E-cadherin (E-cad; red), just before EMT Hif-1α activates Twist, which in turn represses E-cadherin expression, allowing neural crest EMT. In addition, Hif-1α activates Cxcr4, which is required for chemotaxis toward SDF-1.

References

    1. Akimenko M.A., Ekker M., Wegner J., Lin W., Westerfield M. 1994. Combinatorial expression of three zebrafish genes related to distal-less: part of a homeobox gene code for the head. J. Neurosci. 14:3475–3486 - PMC - PubMed
    1. Alfandari D., Cousin H., Gaultier A., Hoffstrom B.G., DeSimone D.W. 2003. Integrin alpha5beta1 supports the migration of Xenopus cranial neural crest on fibronectin. Dev. Biol. 260:449–464 10.1016/S0012-1606(03)00277-X - DOI - PubMed
    1. Aybar M.J., Nieto M.A., Mayor R. 2003. Snail precedes slug in the genetic cascade required for the specification and migration of the Xenopus neural crest. Development. 130:483–494 10.1242/dev.00238 - DOI - PubMed
    1. Barrallo-Gimeno A., Nieto M.A. 2005. The Snail genes as inducers of cell movement and survival: implications in development and cancer. Development. 132:3151–3161 10.1242/dev.01907 - DOI - PubMed
    1. Barrallo-Gimeno A., Holzschuh J., Driever W., Knapik E.W. 2004. Neural crest survival and differentiation in zebrafish depends on mont blanc/tfap2a gene function. Development. 131:1463–1477 10.1242/dev.01033 - DOI - PubMed

Publication types

MeSH terms

Substances

LinkOut - more resources