. 2013 May 27;14(6):11190-207.
doi: 10.3390/ijms140611190.

Angiotensin II regulates microRNA-132/-212 in hypertensive rats and humans

Affiliations

Angiotensin II regulates microRNA-132/-212 in hypertensive rats and humans

Tilde V Eskildsen et al. Int J Mol Sci. .

Abstract

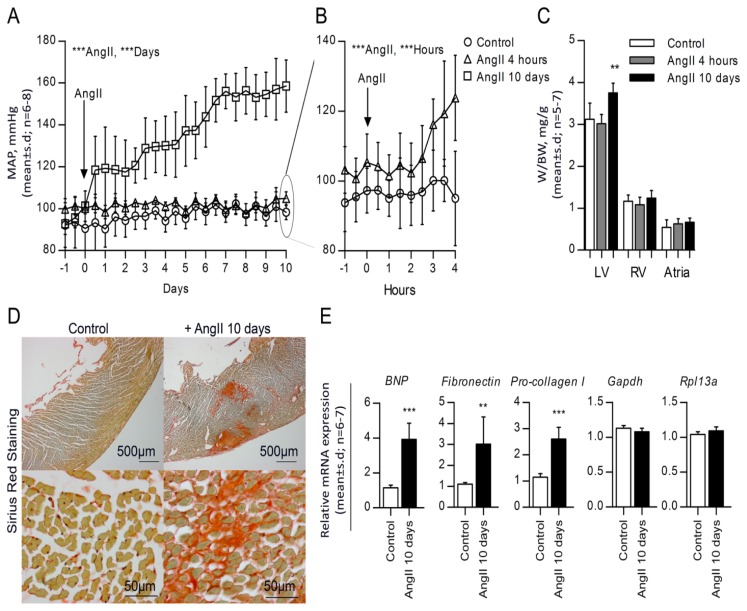
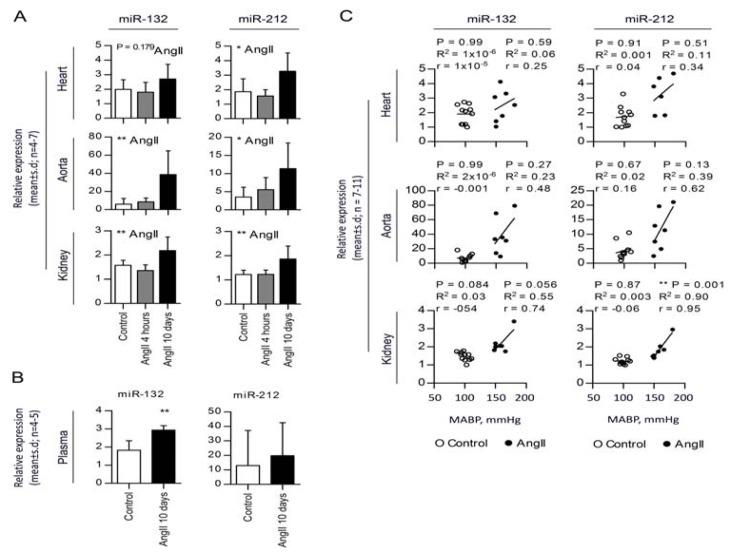
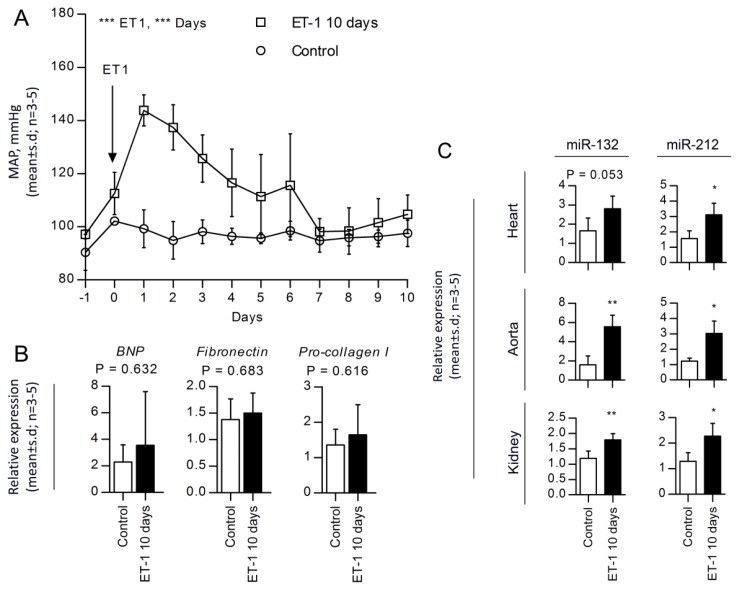
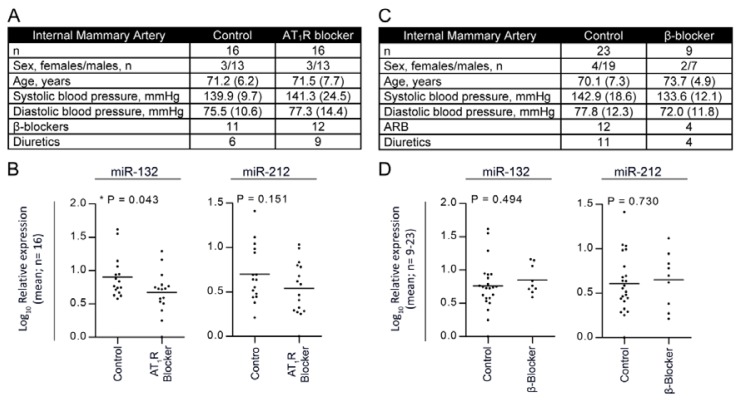
MicroRNAs (miRNAs), a group of small non-coding RNAs that fine tune translation of multiple target mRNAs, are emerging as key regulators in cardiovascular development and disease. MiRNAs are involved in cardiac hypertrophy, heart failure and remodeling following cardiac infarction; however, miRNAs involved in hypertension have not been thoroughly investigated. We have recently reported that specific miRNAs play an integral role in Angiotensin II receptor (AT1R) signaling, especially after activation of the Gαq signaling pathway. Since AT1R blockers are widely used to treat hypertension, we undertook a detailed analysis of potential miRNAs involved in Angiotensin II (AngII) mediated hypertension in rats and hypertensive patients, using miRNA microarray and qPCR analysis. The miR-132 and miR-212 are highly increased in the heart, aortic wall and kidney of rats with hypertension (159 ± 12 mm Hg) and cardiac hypertrophy following chronic AngII infusion. In addition, activation of the endothelin receptor, another Gαq coupled receptor, also increased miR-132 and miR-212. We sought to extend these observations using human samples by reasoning that AT1R blockers may decrease miR-132 and miR-212. We analyzed tissue samples of mammary artery obtained from surplus arterial tissue after coronary bypass operations. Indeed, we found a decrease in expression levels of miR-132 and miR-212 in human arteries from bypass-operated patients treated with AT1R blockers, whereas treatment with β-blockers had no effect. Taken together, these data suggest that miR-132 and miR-212 are involved in AngII induced hypertension, providing a new perspective in hypertensive disease mechanisms.


Figures

Figure 1
Figure 1
Characterization of AngII-induced hypertensive rat. (A) Mean daily averages of mean arterial blood pressure from seven rats treated with chronic infusion of 30 ng/kg/min AngII for 10 days (□) and six rats treated with acute infusion of 30 ng/kg/min AngII for 4 h (Δ), compared to eight control rats (○); (B) Mean hourly averages of mean arterial blood pressure from acute infusion of rats (Δ) for four h compared to control rats (○). Data are shown as the mean ± SD. Arrows shows the start of AngII infusion (day 0). Statistical significance was tested by two-way ANOVA for either control versus AngII for 10 days or control versus AngII for 4 h. ***p < 0.001. A and B, duplicate figure [20]; (C) Weight to body weight ratio (mg/g) of chronic (n = 7), acute (n = 6) and control (n = 8) rat hearts divided into left ventricle, right ventricle and atria. Data is presented as the mean ± SD, and statistical significance was tested by one-way ANOVA using Tukey’s multiple comparison test. **p < 0.01; (D) Representative sections of left ventricles of AngII affected hearts compared to control hearts, stained with Sirius Red for collagen deposition; (E) qRT-PCR for the early marker of hypertrophy, BNP, the fibrotic markers, Fibronectin and Procollagen-I, and the two stably expressed reference genes, Gapdh and Rpl13a (M: 0.140 and CV: 0.049). Data is presented as the mean ± SD, and statistical significance was tested by un-paired t-test. *p < 0.05, **p < 0.01 and ***p < 0.001.
Figure 2
Figure 2
Validation of miRNA regulation in AngII-induced hypertensive rat heart, aorta and kidney. (A) qRT-PCR identification of miRNAs in left ventricle of hearts, aortas and kidneys from AngII affected rat hearts. Statistical significance was tested by one way ANOVA. *p < 0.05. Values are shown as relative expression with the mean ± SD; n = 4–7; (B) qRT-PCR identification of miRNAs in plasma of AngII affected rat hearts. Statistical significance was tested by un-paired t-test. **p < 0.01. Values are shown as relative expression with the mean ± SD; n = 4–5. miRNA expression in the three organs and in plasma was individually normalized to two reference genes stably expressed among the samples. Reference genes used for normalization: Heart, miR-17 and miR-191 (M: 0.356, CV: 0.123); aorta, miR-103 and miR-191 (M: 0.832, CV: 0.290); kidney, miR-17 and miR-191 (M: 0.145, CV: 0.050); and plasma, miR-17 and miR-103 (M: 1.143, CV: 0.390); (C) Correlation analysis for miRNA expression levels at day 10 of AngII or isotone glucose infusion. Statistical significance was tested by linear regression (R2) and correlation analysis (Pearson’s r). Data are shown as two individual correlations per miRNA is each organ for control (○) and AngII for 10 days (●). **p < 0.01; n = 7–11.
Figure 3
Figure 3
Validation of miRNA regulation in AngII-induced hypertensive mice hearts. (A) Mean daily averages of mean arterial blood pressure from three mice treated with chronic infusion of 60, 30 or 15 ng/kg/min AngII for seven days (□, Δ or ◇, respectively), compared to three control mice (○). Data are shown as the mean ± SD. AngII infusion is started at day 0. Statistical significance was tested by two-way ANOVA. ***p < 0.001, *p < 0.05; (B) Left ventricle (LV) weight to body weight ratio (mg/g) of mice infused with 60, 30 or 15 ng/kg/min of AngII for seven days (n = 3) and control (n = 3) mice. Data is presented as the mean ± SD, and statistical significance was tested by one-way ANOVA using Tukey’s multiple comparison test; (C) qRT-PCR identification of miRNAs in left ventricle of hearts from AngII affected mice hearts. Statistical significance was tested by one-way ANOVA using Tukey’s multiple comparison test. Values are shown as relative expression with the mean ± SD; n = 3. Reference genes used for normalization: miR-103 and miR-191 (M: 0.826, CV: 0.288).
Figure 4
Figure 4
Endothelin 1-induced hypertensive rats. (A) Mean daily averages of mean arterial blood pressure from five rats treated with chronic infusion of 5 pmol/kg/min ET-1 for 10 days (□), compared to three control rats (○). Statistical significance was tested by two-way ANOVA. ***p < 0.001; (B) qRT-PCR for the early hypertrophy marker, BNP and the fibrosis markers, Fibronectin and Procollagen-I. Statistical significance was tested by un-paired t-test. Data is shown as the mean ± SD, n = 3–5. Reference genes used for normalization: GAPDH and Rpl13a (M: 0.153, CV: 0.053); (C) qRT-PCR identification of miRNAs in the left ventricle of hearts, aortas and kidneys from ET-1 affected rat hearts. Statistical significance was tested by un-paired t-test. *p < 0.05. Values are shown as relative expression with the mean ± SD, n = 3–5. miRNA expression was individually normalized to two reference genes stably expressed among the samples. Reference genes used for normalization: heart; miR-17 and miR-191 (M: 0.309, CV: 0.107); aorta, miR-103 and miR-191 (M: 0.667, CV: 0.232); kidney, miR-17 and miR-191 (M: 0.180, CV: 0.062).
Figure 5
Figure 5
AngII receptor blockers and β-blockers in internal mammary artery (IMA) patients. (A,C) Study group information on the AngII receptor blocker (ARB) and β-blocker patient groups, respectively. None of the characteristics within the patient groups of ARBs and β-blockers were significantly different. The groups were matched for age, sex, diabetes and treatment using statins. None of the patients were simultaneously treated with angiotensin-converting enzyme (ACE)-inhibitors; (B) Scatter plot represents Log10 relative miRNA expression with mean bar, in patients treated with ARBs compared to patients treated with non-ARB (n = 16). (D) Scatter plot representing Log10 relative miRNA expression with mean bar, in patients treated with β-blocker (n = 9) compared to patients treated with non-β-blockers (n = 23). Expression is normalized to two stably expressed reference genes. Reference genes used for normalization: miR-103 and miR-191 (M: 0.804, CV: 0.279).

Comment in

References

    1. Coffman T.M. Under pressure: The search for the essential mechanisms of hypertension. Nat. Med. 2011;17:1402–1409. - PubMed
    1. Batkai S., Thum T. MicroRNAs in hypertension: Mechanisms and therapeutic targets. Curr. Hypertens. Rep. 2012;14:79–87. - PubMed
    1. Crowley S.D., Gurley S.B., Coffman T.M. AT(1) receptors and control of blood pressure: The kidney and more. Trends Cardiovasc. Med. 2007;17:30–34. - PubMed
    1. Bader M., Ganten D. Update on tissue renin-angiotensin systems. J. Mol. Med. (Berl. ) 2008;86:615–621. - PubMed
    1. Hansen J.L., Aplin M., Hansen J.T., Christensen G.L., Bonde M.M., Schneider M., Haunso S., Schiffer H.H., Burstein E.S., Weiner D.M., et al. The human angiotensin AT(1) receptor supports G protein-independent extracellular signal-regulated kinase 1/2 activation and cellular proliferation. Eur. J. Pharmacol. 2008;590:255–263. - PubMed

Publication types

MeSH terms