. 2013 Jun 3;210(6):1235-49.
doi: 10.1084/jem.20130221. Epub 2013 May 27.

Restricting HIV-1 pathways for escape using rationally designed anti-HIV-1 antibodies

Affiliations

Restricting HIV-1 pathways for escape using rationally designed anti-HIV-1 antibodies

Ron Diskin et al. J Exp Med. .

Abstract

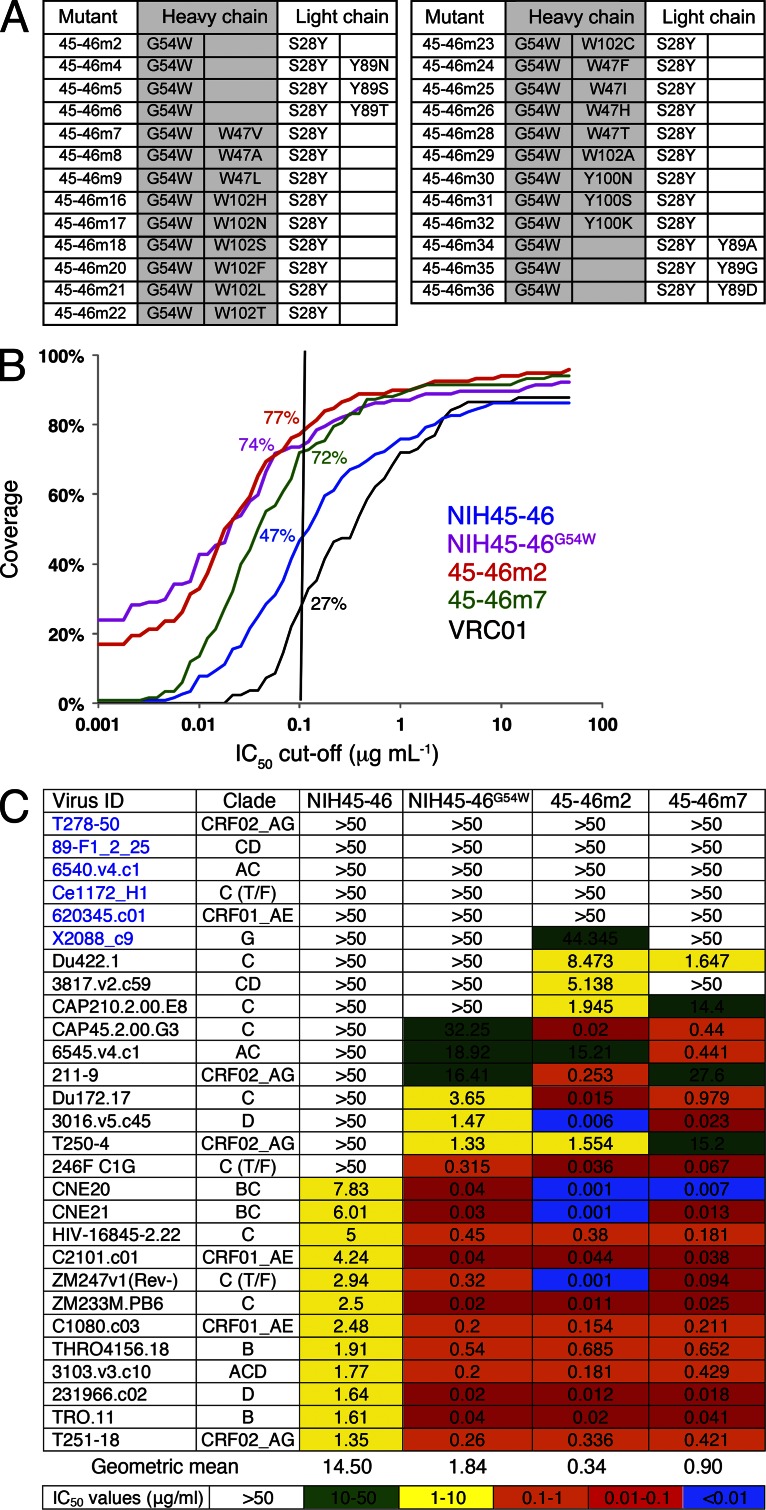
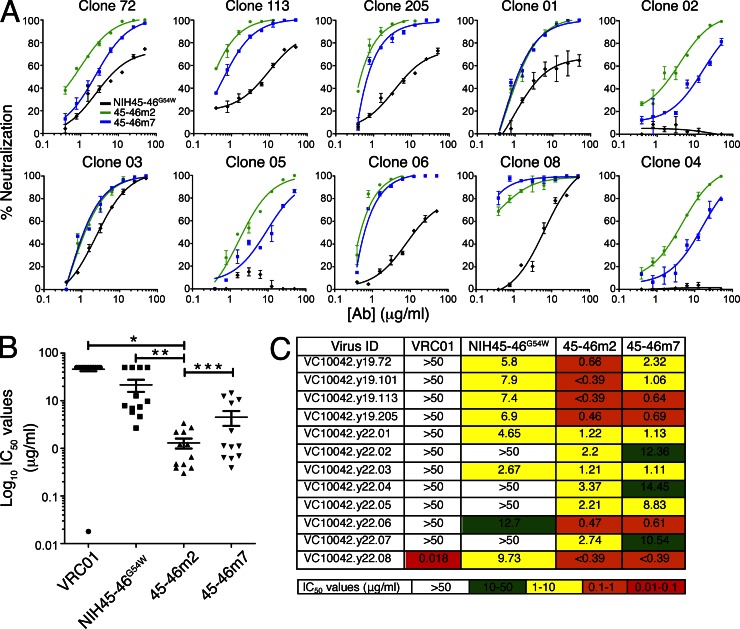
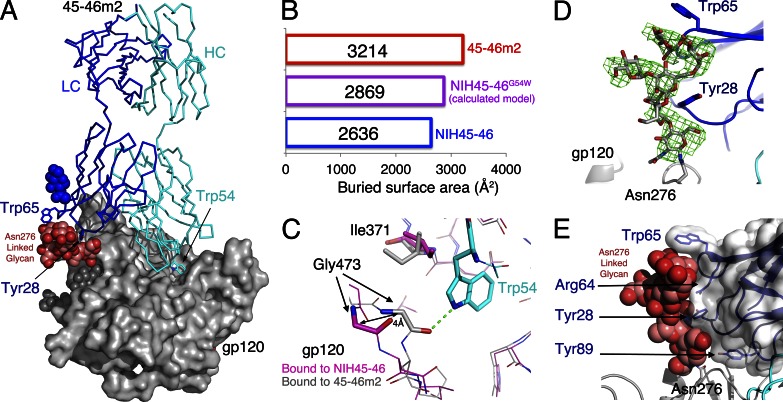
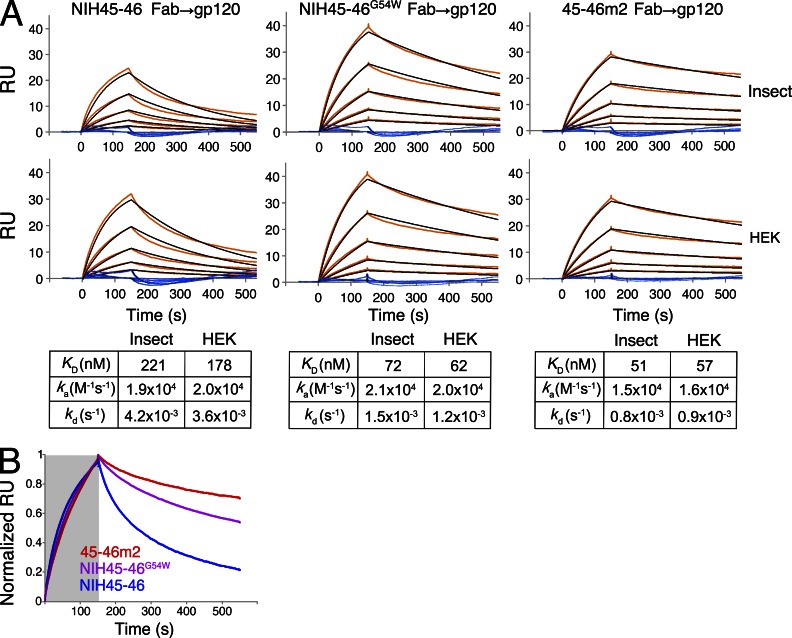
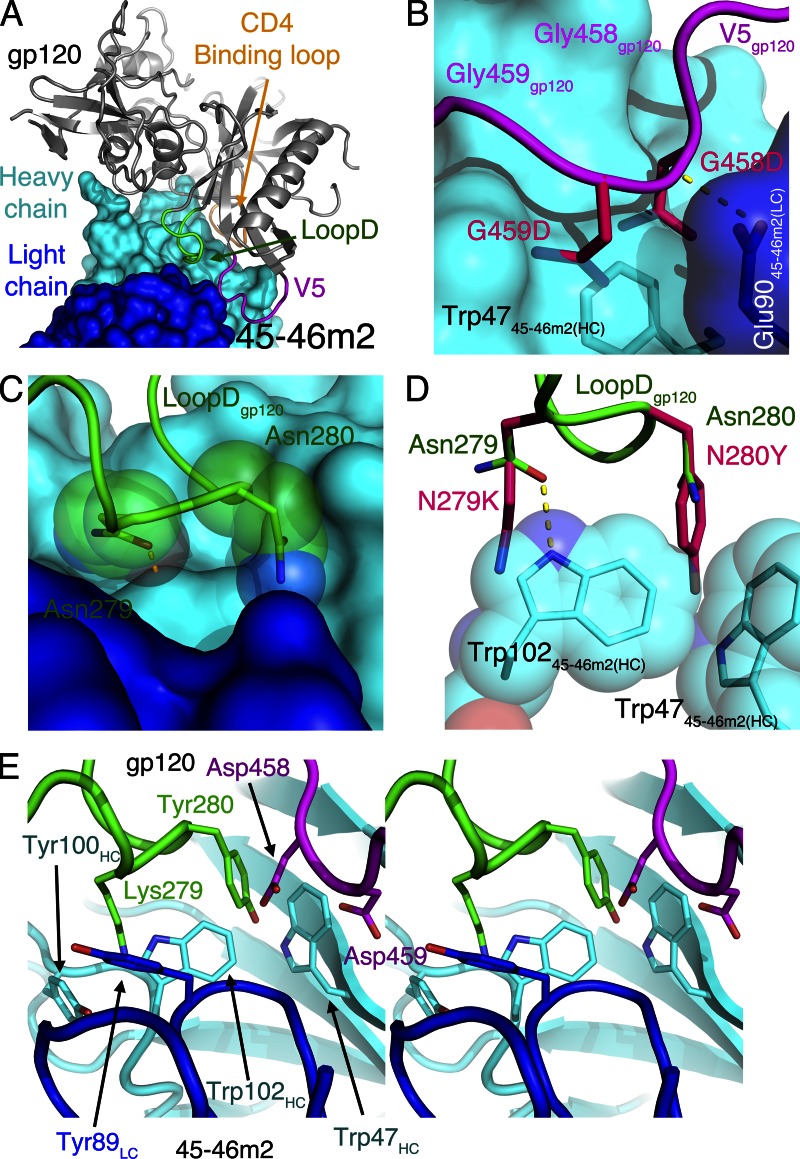
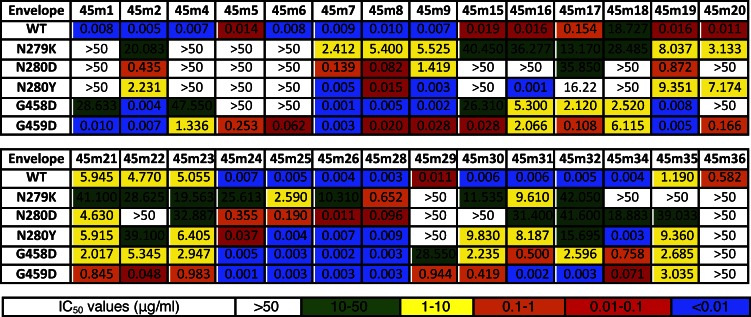
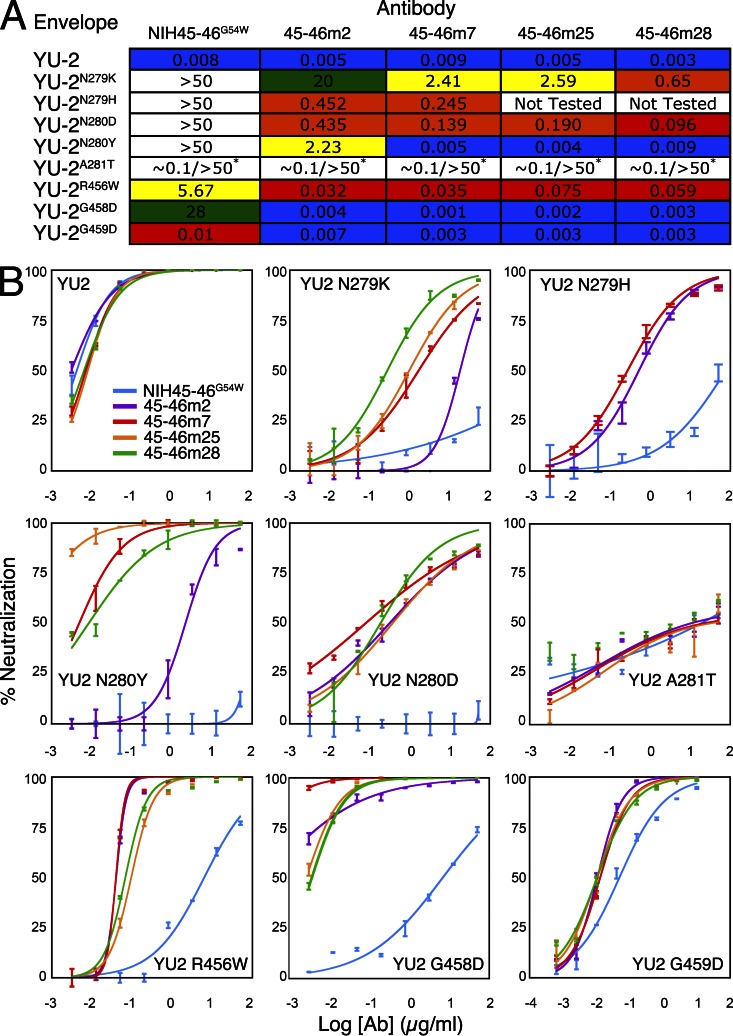
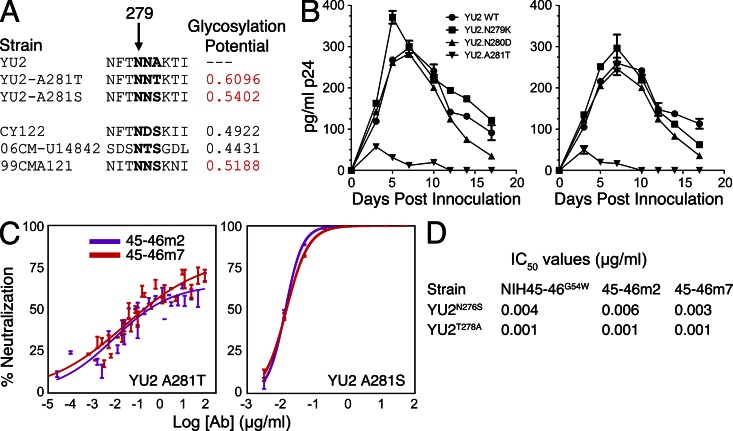
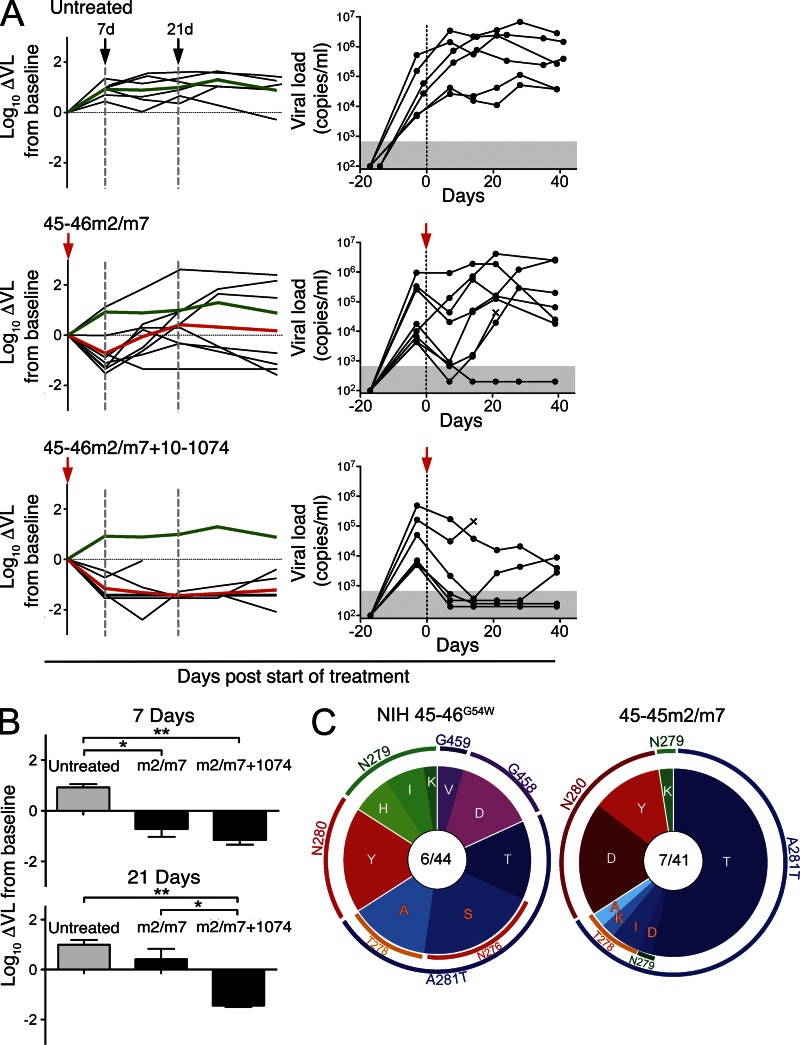
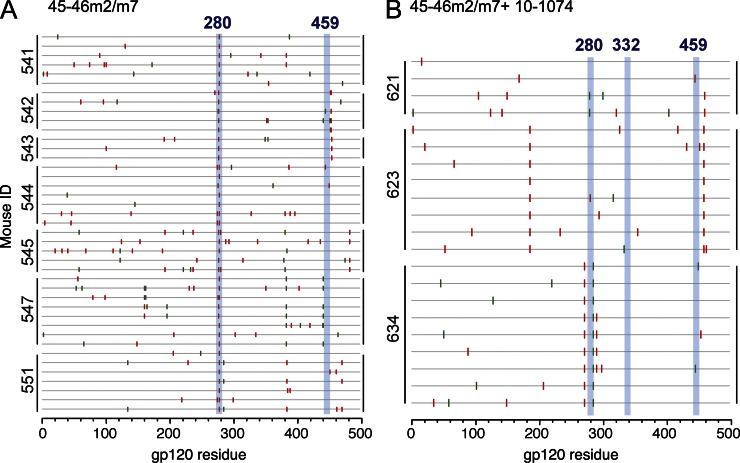
Recently identified broadly neutralizing antibodies (bNAbs) that potently neutralize most HIV-1 strains are key to potential antibody-based therapeutic approaches to combat HIV/AIDS in the absence of an effective vaccine. Increasing bNAb potencies and resistance to common routes of HIV-1 escape through mutation would facilitate their use as therapeutics. We previously used structure-based design to create the bNAb NIH45-46(G54W), which exhibits superior potency and/or breadth compared with other bNAbs. We report new, more effective NIH45-46(G54W) variants designed using analyses of the NIH45-46-gp120 complex structure and sequences of NIH45-46(G54W)-resistant HIV-1 strains. One variant, 45-46m2, neutralizes 96% of HIV-1 strains in a cross-clade panel and viruses isolated from an HIV-infected individual that are resistant to all other known bNAbs, making it the single most broad and potent anti-HIV-1 antibody to date. A description of its mechanism is presented based on a 45-46m2-gp120 crystal structure. A second variant, 45-46m7, designed to thwart HIV-1 resistance to NIH45-46(G54W) arising from mutations in a gp120 consensus sequence, targets a common route of HIV-1 escape. In combination, 45-46m2 and 45-46m7 reduce the possible routes for the evolution of fit viral escape mutants in HIV-1YU-2-infected humanized mice, with viremic control exhibited when a third antibody, 10-1074, was added to the combination.


Figures

Figure 1.
Figure 1.
Comparison of neutralization potencies of 45-46m bNAb mutants. (A) Summary of 45-46m mutants. (B) Coverage curves showing the cumulative frequency of IC50 values up to the concentration shown on the x axis (plot of the percent of viral strains [y axis] from a panel of 118 strains that were neutralized at a given IC50 cutoff [x axis]). A vertical line at 0.1 µg/ml designates a theoretical desired potency for a therapeutic reagent. (C) Table showing IC50 values (µg/ml) for NIH45-46, NIH45-46G54W, 45-46m2, and 45-46m7 against 28 strains that are resistant to or poorly neutralized by NIH45-46. Strains marked in blue have an altered N/DNGG motif. IC50s were derived from curves generated from data points obtained in duplicate or triplicate.
Figure 2.
Figure 2.
Neutralization of highly resistant viral clones from patient VC10042. (A) Neutralization curves for NIH45-46G54W, 45-46m2, and 45-46m7 against 10 viral clones from patient VC10042 that were isolated 19 yr (first three panels) or 22 yr (remaining panels) after infection. (B) Scatter plot comparing IC50 values (µg/ml) for VRC01, NIH45-46G54W, 45-46m2, and 45-46m7 against viral clones from patient VC10042. Despite their breadth, 45-46m2 and 45-46m7 did not neutralize SIV strains (SIVmac251 and SIVsmE660; not depicted). (C) IC50 values (µg/ml) for NIH45-46G54W, 45-46m2, and 45-46m7 against viral clones from patient VC10042. The reported IC50 values represent the mean of two independent experiments, each with two replicates. Significance of statistical differences: * (VRC01 and 45-46m2), P < 0.0001; ** (NIH45-46G54W and 45-46m2), P = 0.0033; *** (45-46m2 and 45-46m7), P = 0.0274. Error bars represent standard deviation from the mean.
Figure 3.
Figure 3.
45-46m2–gp120 complex structure. (A) 45-46m2/gp120 structure with gp120 as a gray surface and 45-46m2 Fab in cyan (HC) and blue (LC) Cα traces. Ordered N-glycans are shown in van der Waals representation, with the Asn276gp120–linked N-glycan highlighted in shades of red. The locations of Tyr2845-46m2(LC) and Trp5445-46m2(HC) are indicated by arrows. (B) Buried surface areas between gp120 and the indicated antibodies. The buried surface area for NIH45-46G54W was calculated by adding the contribution of Trp54 (derived from the structure of 45-46m2/gp120) to the buried surface area calculated from the NIH45-46/gp120 structure. (C) Close-up comparison of the interactions of Trp5445-46m2 (cyan side chain) and Gly54NIH45-46 (magenta) with gp120 in the structures of 45-46m2/gp120 (gray) and NIH45-46/gp120 (magenta). A hydrogen bond (green dashed line) between the nitrogen atom of the Trp5445-46m2 indole ring and the main chain carbonyl oxygen of Gly473gp120 creates a 4 Å shift (black arrow; Cα-Cα distance) of the gp120 main chain toward Trp5445-46m2, and Ile371gp120 adopts a different rotamer to accommodate Trp5445-46m2. (D) Electron density (green mesh; σ = 2) for an N-linked glycan attached to Asn276gp120. A portion from the final model of the 45-46m2–gp120 complex is superimposed on an Fo-Fc electron density map calculated using the initial model before adding the glycan and after several rounds of simulated annealing refinement. (E) Close-up of the Asn276gp120–attached glycan and its interactions with the 45-46m2 LC (semitransparent surface). Side chains of Tyr2845-46m2, Trp6545-46m2, Arg6445-46m2, and Tyr8945-46m2 are shown as sticks.
Figure 4.
Figure 4.
SPR comparisons of the binding of gp120 to NIH45-46, NIH4546G54W, and 45-46m2 Fabs. (A) Sensograms (orange curves) were recorded for the interactions of injected 93TH057 gp120 produced in insect (Hi5) and mammalian (HEK293) cells over immobilized Fabs derived from the indicated antibodies in a twofold dilution series ranging from 500 to 31 nM. Kinetic constants (ka, kd) were derived from globally fitting the association and dissociation phases using a 1:1 binding model (black curves) and affinities were calculated as KD = kd/ka. Residual plots (blue) within each sensogram describe the fit of the model to the data. Each binding experiment was conducted twice; once using gp120 produced in insect cells and once using gp120 produced in mammalian cells. (B) SPR measurements of 500 nM injected 93TH057 gp120 over the indicated immobilized Fabs. Each curve was normalized to its Rmax. The gray and white shaded areas designate the association and dissociation phases, respectively.
Figure 5.
Figure 5.
Steric constraints associated with the gp120 N/DNGG motif. (A) Overview of loop D (green) and the V5 loop (magenta) of gp120 (gray) interacting with the surface of the 45-46m2 HC (cyan) and LC (blue). The CD4-binding loop of gp120 is shown in orange. (B) gp120 V5 loop region showing Gly458gp120 and Gly459gp120 with overlaid prediction of the consequences of aspartic acid substitutions at these positions (Asp458gp120 and Asp459gp120; pink sticks). Both aspartic acids could clash with Trp4745-46m2(HC). (C) Asn279gp120 and Asn280gp120 (sticks and semitransparent spheres) interactions with 45-46m2. A hydrogen bond (orange dashed line) between Asn279gp120 and the nitrogen atom of the Trp10245-46m2(HC) indole ring is shown. (D) Possible steric clashes between a lysine or a tyrosine in gp120 positions 279 and 280 (pink) and Trp10245-46m2(HC) and Trp4745-46m2(HC). (E) Stereo image showing modeled substitutions in the gp120 N/DNGG consensus sequence (Lys279gp120, Tyr280gp120, Asp458gp120, and Asp459gp120) at the interface with 45-46m2. Tyr10045-46m2 HC and Tyr8945-46m2 LC, which may impose steric constraints for the binding of gp120s with nonconsensus substitutions, are shown together with Trp10245-46m2 HC and Trp4745-46m2 HC.
Figure 6.
Figure 6.
Neutralization of YU-2 mutant strains by 45-46m antibodies. Mean IC50 values (µg/ml) derived from in vitro neutralization assays for 45-4m antibodies against YU-2 mutants. Three or more independent neutralization assays were performed for each mutant.
Figure 7.
Figure 7.
Neutralization of YU-2 mutant strains by selected 45-46m antibodies. (A) IC50 values (µg/ml) derived from in vitro neutralization assays for selected 45-4m antibodies against YU-2 mutant strains. Five independent neutralization assays were performed for each mutant. (B) Neutralization curves for selected YU-2 mutant strains. Error bars represent standard deviation from the mean.
Figure 8.
Figure 8.
Analysis of the potential N-linked glycosylation site at Asn279gp120. (A) Sequence alignment of YU-2, the two YU-2 Ala281gp120 mutants, and the three known HIV strains with a potential N-linked glycosylation site at Asn279gp120. The glycosylation potential for Asn279gp120 was calculated for each strain using NetNGlyc 1.0 Server. A glycosylation site is predicted (red highlighted numbers) if the glycosylation potential is ≥0.5. (B) Replication profiles of YU-2 escape mutants. Two independent experiments compared the replication of various YU-2 escape mutants to YU-2 WT in PBMC cell culture. Levels of virus in the supernatant were determined by measuring p24 levels at various time points after inoculation, and each value represents the mean of two replicates each from two independent experiments. (C) Neutralization curves for 45-46m2 and 45-46m7 against YU-2A281T and YU-2A281S. The curves for YU-2A281T were derived using an extended concentration series. Error bars represent standard deviation from the mean. (D) Neutralization of A281T-associated mutations affecting the Asn276gp120-linked glycan.
Figure 9.
Figure 9.
HIV-1 therapy by a combination of two (45-46m2 + 45-46m7, labeled 45-46m2/m7) or three (45-46m2/m7 + 10–1074) bNAbs in HIV-1YU2–infected humanized mice. (A) Viral load. Left panels: viral load change from baseline (log10 HIV-1 RNA copies/ml). Right panels: absolute viral load per mouse (RNA copies/ml). Each line represents a single mouse. Red arrows indicate start of antibody treatment; green lines, geometric mean of untreated mice; red lines, geometric mean of antibody treatment group indicated. Treatment groups were analyzed in parallel and reflect a single experiment comprising six control animals (untreated), eight mice treated with 45-46m2/m7, and six animals treated with the combination 45-46m2/m7 + 10–1074. Similar results were obtained for the 45-46m2/m7 group in an independent experiment involving six mice (not depicted). (B) Mean viral load change (log10 HIV-1 RNA copies/ml) from baseline at the indicated number of days from start of therapy (mean and standard error are shown). Statistical test: Kruskal-Wallis test with Dunn’s multiple comparison post-hoc test. Asterisks (*, P ≤ 0.05; **, P ≤ 0.01) reflect statistically significant differences between the treatment groups indicated. (C) Pie charts illustrate the distribution of amino acid changes in gp120 at sites targeted by NIH45-46G54W (left; data from Klein et al., 2012) versus the 45–46(m2/m7) combination (right). Wedge sizes reflect the percent of gp120 sequences carrying the indicated resistance mutation at the time of viral rebound. Center numbers refer to the number of mice (left) and the number of gp120 sequences (right) for each set of data. Mutations listed within the A281T sector of the 45-46m2/m7 pie chart reflect compensatory mutations accompanying A281T.
Figure 10.
Figure 10.
Mutation analysis of gp120 sequences during antibody therapy. HIV-1YU2–infected humanized mice were treated with a combination of two (45-46m2 + 45-46m7, labeled 45-46m2/m7; A) or three (45-46m2/m7 + 10–1074; B) bNAbs and the sequences of gp120s from escape mutant viruses were determined. Individual gp120 nucleotide sequences are represented by horizontal gray bars with silent mutations indicated in green and replacement mutations in red. Shaded vertical lines indicated regions that allowed escape from NIH45-46G54W (amino acid positions 280 and 459) and from 10–1074 (amino acid position 332). All substitutions are relative to HIV-1YU2 (accession no. M93258) and numbered according to HXB2.

References

    1. Adams P.D., Afonine P.V., Bunkóczi G., Chen V.B., Davis I.W., Echols N., Headd J.J., Hung L.W., Kapral G.J., Grosse-Kunstleve R.W., et al. 2010. PHENIX: a comprehensive Python-based system for macromolecular structure solution. Acta Crystallogr. D Biol. Crystallogr. 66:213–221 10.1107/S0907444909052925 - DOI - PMC - PubMed
    1. Baba T.W., Liska V., Hofmann-Lehmann R., Vlasak J., Xu W., Ayehunie S., Cavacini L.A., Posner M.R., Katinger H., Stiegler G., et al. 2000. Human neutralizing monoclonal antibodies of the IgG1 subtype protect against mucosal simian-human immunodeficiency virus infection. Nat. Med. 6:200–206 10.1038/72309 - DOI - PubMed
    1. Baenziger S., Tussiwand R., Schlaepfer E., Mazzucchelli L., Heikenwalder M., Kurrer M.O., Behnke S., Frey J., Oxenius A., Joller H., et al. 2006. Disseminated and sustained HIV infection in CD34+ cord blood cell-transplanted Rag2-/-gamma c-/- mice. Proc. Natl. Acad. Sci. USA. 103:15951–15956 10.1073/pnas.0604493103 - DOI - PMC - PubMed
    1. Balazs A.B., Chen J., Hong C.M., Rao D.S., Yang L., Baltimore D. 2012. Antibody-based protection against HIV infection by vectored immunoprophylaxis. Nature. 481:81–84 10.1038/nature10660 - DOI - PMC - PubMed
    1. Collaborative Computational Project, Number 4 1994. The CCP4 suite: programs for protein crystallography. Acta Crystallogr. D Biol. Crystallogr. 50:760–763 10.1107/S0907444994003112 - DOI - PubMed

Publication types

MeSH terms

Substances

Associated data