

Mass profiling of serum to distinguish mice with pancreatic cancer induced by a transgenic Kras mutation
- PMID: 23712558
- PMCID: PMC3787968
- DOI: 10.1002/ijc.28285
Mass profiling of serum to distinguish mice with pancreatic cancer induced by a transgenic Kras mutation
Abstract
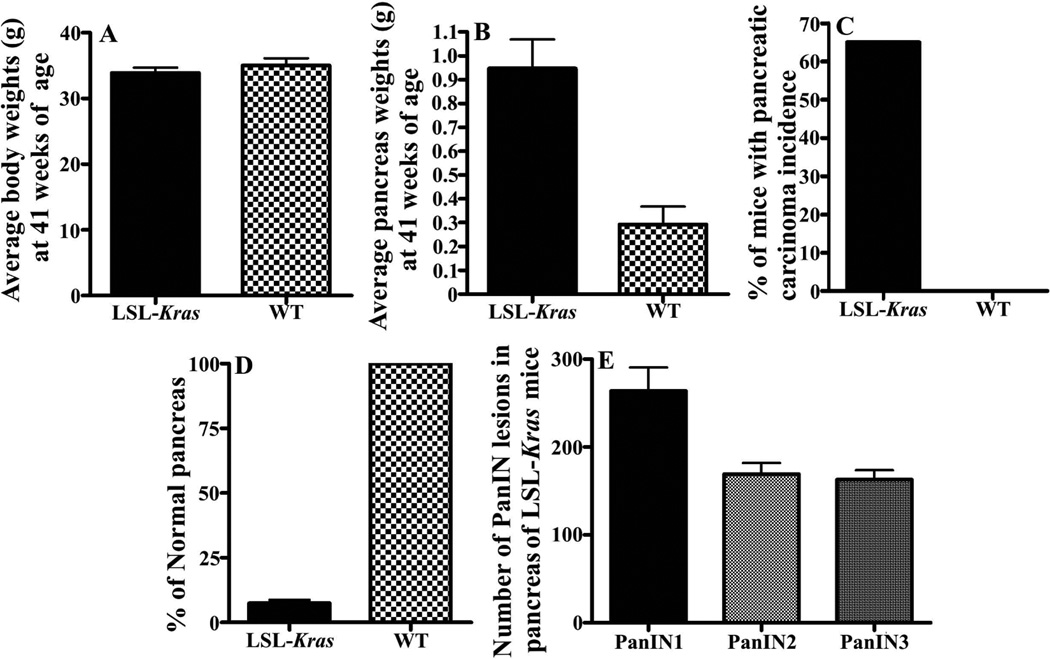
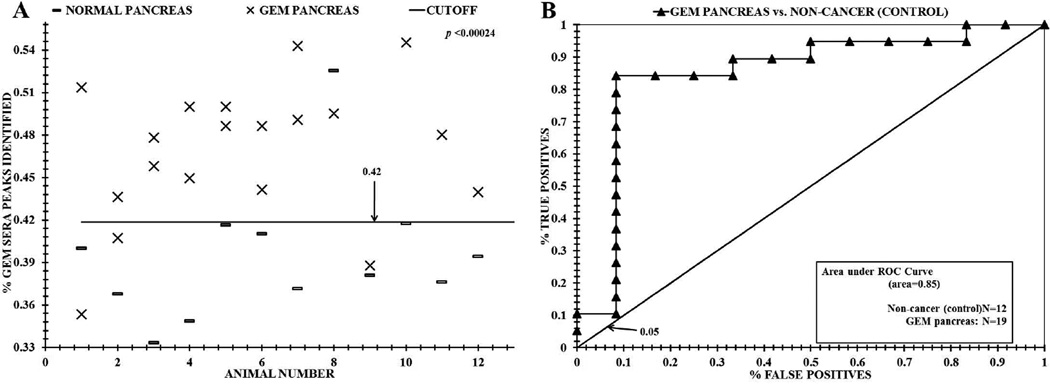
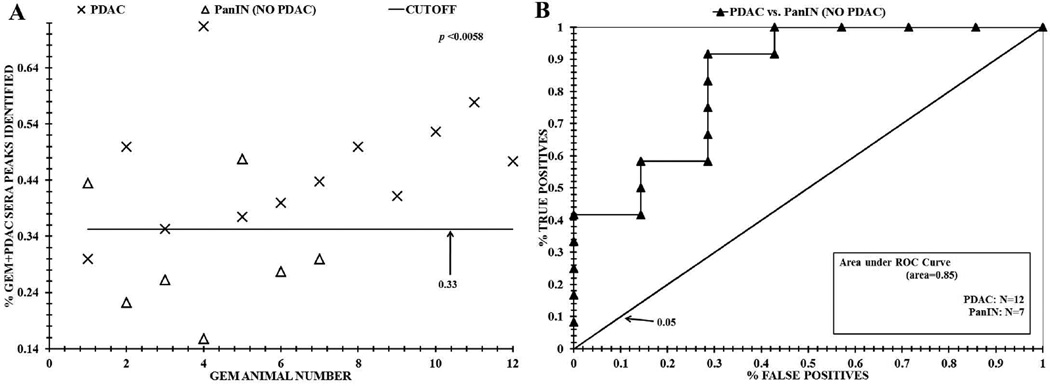
Mass spectrometry (MS) has the unique ability to profile, in an easily accessible body tissue (peripheral blood/serum,) the sizes and relative amounts of a wide variety of biomolecules in a single platform setting. Using electrospray ionization (ESI)-MS, we distinguished individual serum from wild-type control mice from serum of mice containing an oncogenic Kras mutation, which leads to development of pancreatic ductal adenocarcinoma (PDAC) similar to that observed in humans. Identification of differences in significant ESI-MS sera mass peaks between Kras-activated mice and control mice was performed using t tests and a "nested leave one out" cross-validation procedure. Peak distributions in serum of control mice from mice with Kras-mutant-dependent PDAC were distinguished from those of pancreatic intraepithelial neoplasia (PanIN) lesions (p = 0.00024). In addition, Kras mutant mice with PDAC were distinguished from Kras mutant mice with PanIN alone (p = 0.0057). Test specificity, a measure of the false positives, was greater for the control vs. Kras mutated mice, and the test sensitivity, a measure of false negatives, was greater for the PDAC vs. PanIN containing mice. Receiver-operating characteristic (ROC) curve discriminatory values were 0.85 for both comparisons. These studies indicate ESI-MS serum mass profiling can detect physiological changes associated with pancreatic cancer initiation and development in a GEM (genetic engineered mouse) model that mimics pancreatic cancer development in humans. Such technology has the potential to aid in early detection of pancreatic cancer and in developing therapeutic drug interventions.
Keywords: Kras mutation; early detection; electrospray mass spectrometry; genetically engineered mouse; pancreatic cancer; serum profiling.
Copyright © 2013 UICC.
Conflict of interest statement
Authors report no financial disclosure or conflict of interest.
Figures


References
-
- American Cancer Society. Cancer facts & figures. Atlanta (GA): American Cancer Society; 2011.
-
- Jones S, Zhang X, Parsons DW, Lin JCH, Leary RJ, Angenendt P, Mankoo P, Carter H, Kamiyama H, Jimeno A, Hong SM, Fu B, Lin MT, Calhoun ES, Kamiyama M, Walter K, Nikolskaya T, Nikolsky Y, Hartigan J, Smith DR, Hidalgo M, Leach SD, Klein AP, Jaffee EM, Goggins M, Maitra A, Donahue CI, Eshleman JR, Kern SE, Hruban RH, Karchin R, Papadopoulos N, Parmigiani G, Vogelstein B, Velculescu VE, Kinzler KW. Core Signaling Pathways in Human Pancreatic Cancers Revealed by Global Genomic Analyses. Science. 2008;321:1801–1806. - PMC - PubMed
-
- Gattani AM, Mandeli J, Bruckner HW. Tumor markers in patients with pancreatic carcinoma. Cancer. 1996;78:57–62. - PubMed
-
- Baker M. MicroRNA profiling: separating signal from noise. Nat Methods. 2010;7:687–692. - PubMed
Publication types
MeSH terms
Substances
Grants and funding
LinkOut - more resources
Full Text Sources
Other Literature Sources
Medical
Molecular Biology Databases
Research Materials
Miscellaneous
