

DeMix: deconvolution for mixed cancer transcriptomes using raw measured data
- PMID: 23712657
- PMCID: PMC3841439
- DOI: 10.1093/bioinformatics/btt301
DeMix: deconvolution for mixed cancer transcriptomes using raw measured data
Abstract
Motivation: Tissue samples of tumor cells mixed with stromal cells cause underdetection of gene expression signatures associated with cancer prognosis or response to treatment. In silico dissection of mixed cell samples is essential for analyzing expression data generated in cancer studies. Currently, a systematic approach is lacking to address three challenges in computational deconvolution: (i) violation of linear addition of expression levels from multiple tissues when log-transformed microarray data are used; (ii) estimation of both tumor proportion and tumor-specific expression, when neither is known a priori; and (iii) estimation of expression profiles for individual patients.
Results: We have developed a statistical method for deconvolving mixed cancer transcriptomes, DeMix, which addresses the aforementioned issues in array-based expression data. We demonstrate the performance of our model in synthetic and real, publicly available, datasets. DeMix can be applied to ongoing biomarker-based clinical studies and to the vast expression datasets previously generated from mixed tumor and stromal cell samples.
Availability: All codes are written in C and integrated into an R function, which is available at http://odin.mdacc.tmc.edu/∼wwang7/DeMix.html.
Contact: wwang7@mdanderson.org
Supplementary information: Supplementary data are available at Bioinformatics online.
Figures
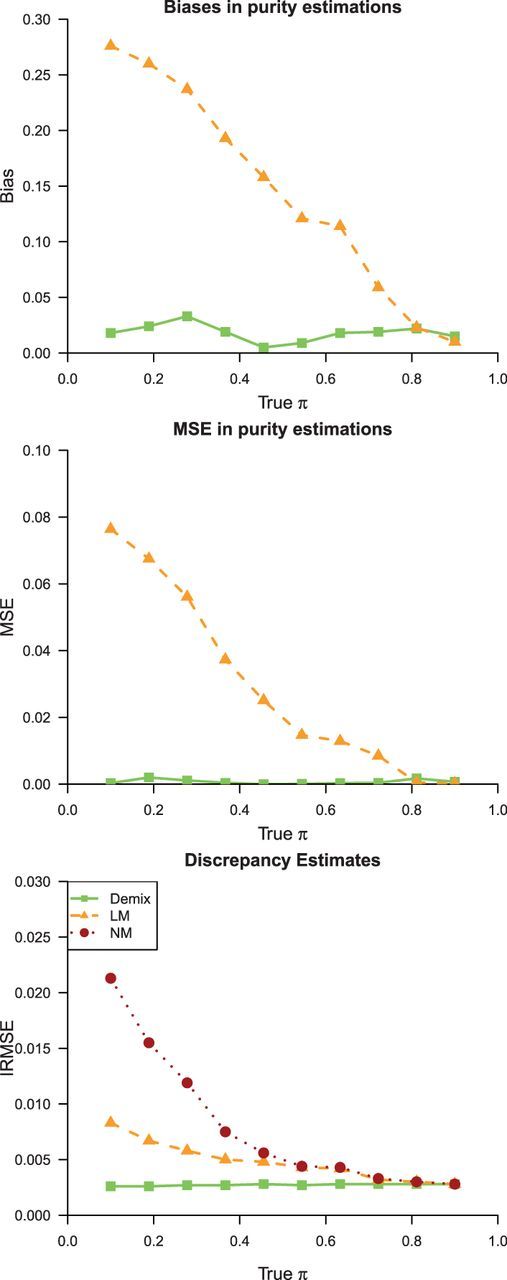
 ) varying from 0.1 to 0.9. For IRMSE, we also present results from the NM model
 's; solid lines correspond to true π's
References
-
- Carvalho B, et al. Exploration, normalization, and genotype calls of high-density oligonucleotide SNP array data. Biostatistics. 2007;8:485–499. - PubMed
-
- Efron B. Bootstrap methods: Another look at the jackknife. Ann. Stat. 1979;7:1–26.
-
- Emmert-Buck MR, et al. Laser capture microdissection. Science. 1996;274:998–1001. - PubMed
Publication types
MeSH terms
Grants and funding
LinkOut - more resources
Full Text Sources
Other Literature Sources
