. 2013 Sep 15;591(18):4567-79.
doi: 10.1113/jphysiol.2013.254292. Epub 2013 May 27.

The bioelectrical basis and validity of gastrointestinal extracellular slow wave recordings

Affiliations

The bioelectrical basis and validity of gastrointestinal extracellular slow wave recordings

Timothy R Angeli et al. J Physiol. .

Abstract

Gastrointestinal extracellular recordings have been a core technique in motility research for a century. However, the bioelectrical basis of extracellular data has recently been challenged by claims that these techniques preferentially assay movement artifacts, cannot reproduce the underlying slow wave kinetics, and misrepresent the true slow wave frequency. These claims motivated this joint experimental-theoretical study, which aimed to define the sources and validity of extracellular potentials. In vivo extracellular recordings and video capture were performed in the porcine jejunum, before and after intra-arterial nifedipine administration. Gastric extracellular recordings were recorded simultaneously using conventional serosal contact and suction electrodes, and biphasic and monophasic extracellular potentials were simulated in a biophysical model. Contractions were abolished by nifedipine, but extracellular slow waves persisted, with unchanged amplitude, downstroke rate, velocity, and downstroke width (P>0.10 for all), at reduced frequency (24% lower; P=0.03). Simultaneous suction and conventional serosal extracellular recordings were identical in phase (frequency and activation-recovery interval), but varied in morphology (monophasic vs. biphasic; downstroke rate and amplitude: P<0.0001). Simulations demonstrated the field contribution of current flow to extracellular potential and quantified the effects of localised depolarisation due to suction pressure on extracellular potential morphology. In sum, these results demonstrate that gastrointestinal extracellular slow wave recordings cannot be explained by motion artifacts, and are of a bioelectrical origin that is highly consistent with the underlying biophysics of slow wave propagation. Motion suppression is shown to be unnecessary as a routine control in in vivo extracellular studies, supporting the validity of the extant gastrointestinal extracellular literature.


Figures

Figure 1
Figure 1. Extracellular slow wave recording modalities
A, a suction electrode and conventional serosal contact electrodes were employed simultaneously in vivo on adjacent sections of the gastric serosa. B, the tip of the capillary of the suction electrode was indented slightly into the gastric serosa. C, the conventional serosal contact electrodes were placed directly on the serosa, and held in contact with gentle overlying pressure using soaked gauze. D and E, experimental recordings of slow waves recorded by the conventional serosal contact (D) and suction electrode (E) are shown.
Figure 2
Figure 2. Schematic models of (A) conventional serosal contact electrode and (B) suction electrode recordings
All values shown are in millimetres. Electrode position and fibre radius and length were identical for each electrode type. Signals were evaluated at four locations: at 3 mm in each direction from the centre of the electrode (x= 1.5 and 7.5 mm), and at each edge of the electrode (x dependent on electrode contact diameter, with values as shown).
Figure 3
Figure 3. Comparison of intestinal slow wave potentials before and after nifedipine administration
L-maps of video analysis are shown in A and B; yellow bands show contraction and blue bands show relaxation. A, contractile activity was evident in 4/5 pigs before nifedipine was administered. In this recording, widespread segmental contractions occurred at a frequency of 2.3 cycles min−1. B, nifedipine abolished detectable motion in all experiments, with only random background noise observed. This recording is from the same intestinal segment as A, after nifedipine was administered. C and D, electrograms. Slow waves were observed in all recordings before and after the application of nifedipine, with representative signals shown. Full quantification of slow wave characteristics is reported in Table 1. E and F, activation maps showing the propagation of a single slow wave in time, from orange (early) to blue (late). Slow wave propagation patterns remained similar before and after the administration of nifedipine. Activation maps are presented with 0.5 s isochronal intervals.
Figure 4
Figure 4. Gastric extracellular slow wave potentials
A, a monophasic electrode signal recorded experimentally by the suction electrode (Fig. 1A) with activation and recovery times marked by a dot • and +, respectively. B and C, the first and second derivative of the monophasic suction electrode signal of the monophasic suction electrode signal. D, the biphasic electrode signal was recorded experimentally by a conventional serosal contact electrode (Fig. 1B) with the activation and recovery times marked by a dot • and +, respectively. The activation–recovery interval was consistent between the biphasic and monophasic waveforms (refer Table 2). The biphasic signal demonstrated a morphology that was consistent with the smoothed second derivative of the monophasic suction electrode (C).
Figure 5
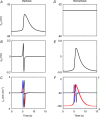
Figure 5. Gastric slow wave extracellular potentials simulated in the model outlined in Fig. 2
Left column: biphasic potential (conventional serosal contact electrode); right column: monophasic potential (suction electrode). A, simulated membrane potential sampled at x= 4.5 mm along the fibre; B, simulated extracellular potential at 2.66 mm away from the fibre; C, Im sampled at four points at x= 1.5 (blue), 4.35 (red), 4.65 (red), and 7.5 mm (black). The two traces shown in red are nearest to the electrode and are nearly identical in time. D, simulated membrane potential sampled at x = 4.5 mm along the fibre. To simulate suction pressure, the membrane potential was held at −32 mV; E, simulated extracellular potential; F, Im sampled at four points at x= 1.5 (blue), 3.9 (red), 5.1 (red), and 7.5 mm (black). The two traces shown in red are nearest to the electrode and are nearly identical in time. The left axis correlates to the monophasic red traces, and the right axis correlates to the biphasic blue and black traces. The morphologies of the modelled biphasic and monophasic potentials were concordant with the experimental data obtained using these techniques (Figs 1 and 4).

Comment in

Similar articles

Cited by

References

    1. Alvarez WC, Hosoi K. What has happened to the unobstructed bowel that fails to transport fluids & gas. Am J Surg. 1929;6:569–578.
    1. Alvarez WC, Mahoney LJ. Action currents in stomach and intestine. Am J Physiol Gastrointest Liver Physiol. 1922;58:G476–G493.
    1. Angeli TR, O’Grady G, Du P, Paskaranandavadivel N, Pullan AJ, Bissett IP, Cheng LK. Circumferential and functional re-entry of in vivo slow-wave activity in the porcine small intestine. Neurogastroenterol Motil. 2013a;25:e304–e314. - PMC - PubMed
    1. Angeli TR, O’Grady G, Paskaranandavadivel N, Erickson JC, Du P, Pullan AJ, Bissett IP, Cheng LK. Experimental and automated analysis techniques for high-resolution electrical mapping of small intestine slow wave activity. J Neurogastroenterol Motil. 2013b;19:179–191. - PMC - PubMed
    1. Barr RC. Basic Electrophysiology. In: Bronzino JD, editor. The Biomedical Engineering Handbook: Second Edition. Boca Raton, FL, USA: CRC Press LLC; 2000.

Publication types

LinkOut - more resources