. 2013 Jul 5;12(7):3246-54.
doi: 10.1021/pr400067k. Epub 2013 Jun 10.

Rapid assessment of RNAi-mediated protein depletion by selected reaction monitoring mass spectrometry

Affiliations

Rapid assessment of RNAi-mediated protein depletion by selected reaction monitoring mass spectrometry

Veronika A Glukhova et al. J Proteome Res. .

Abstract

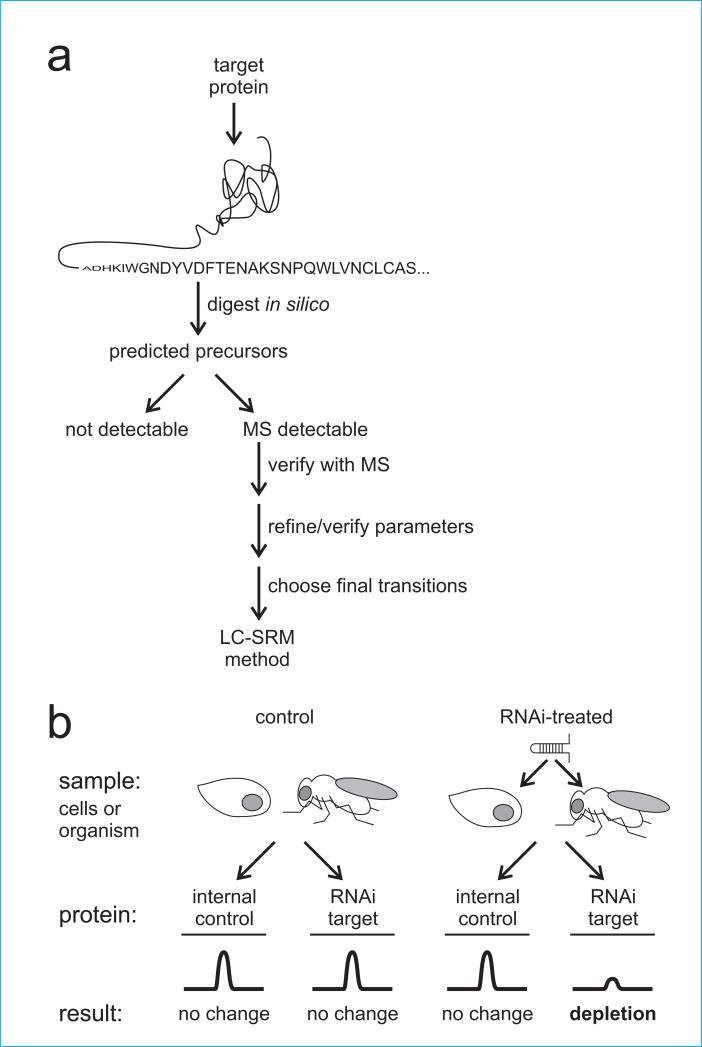
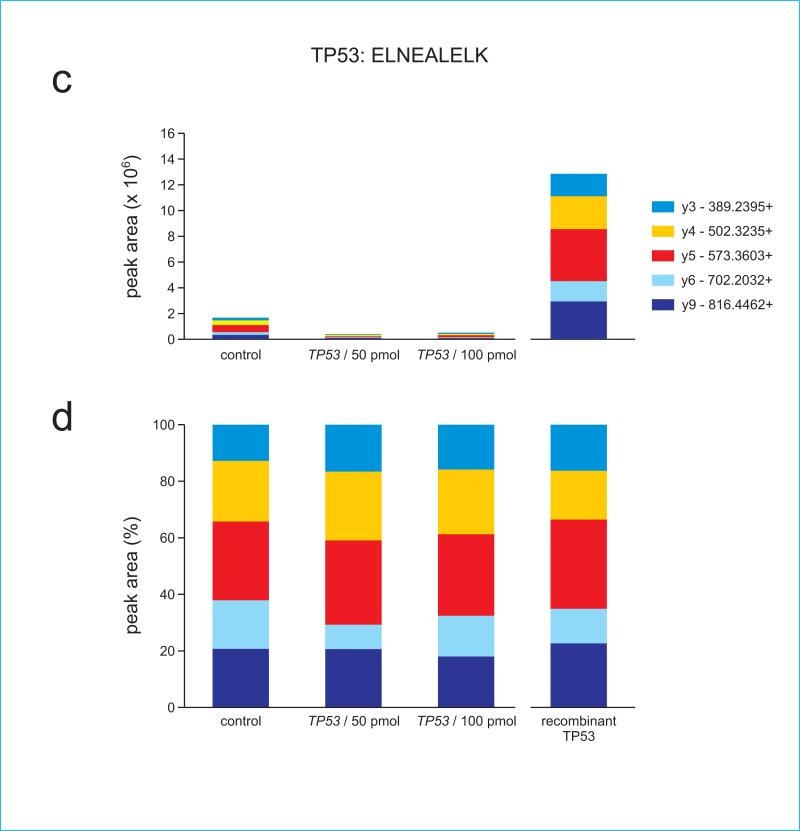
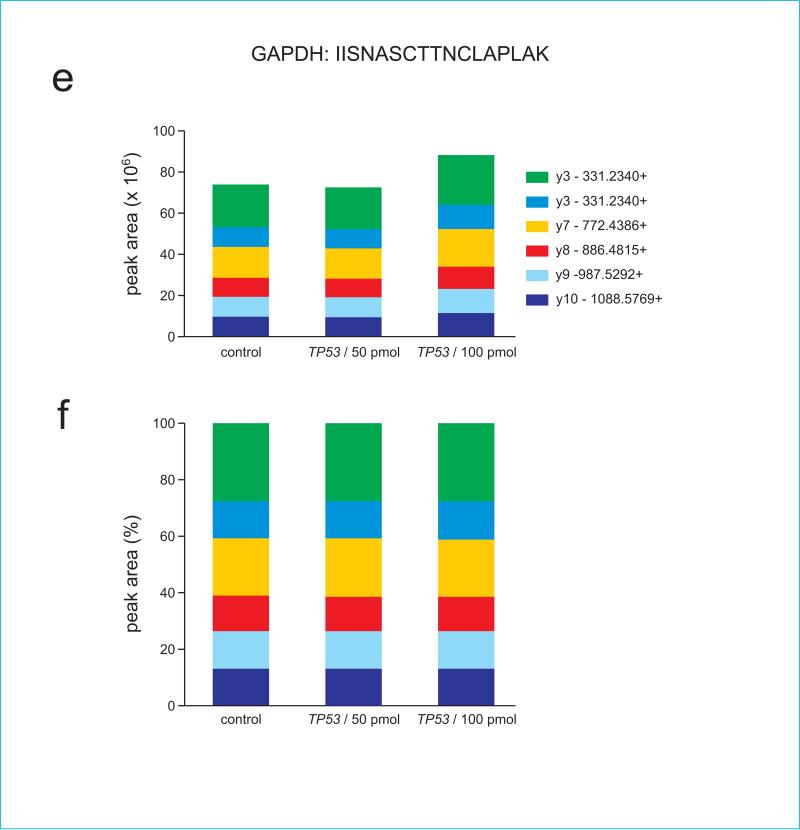
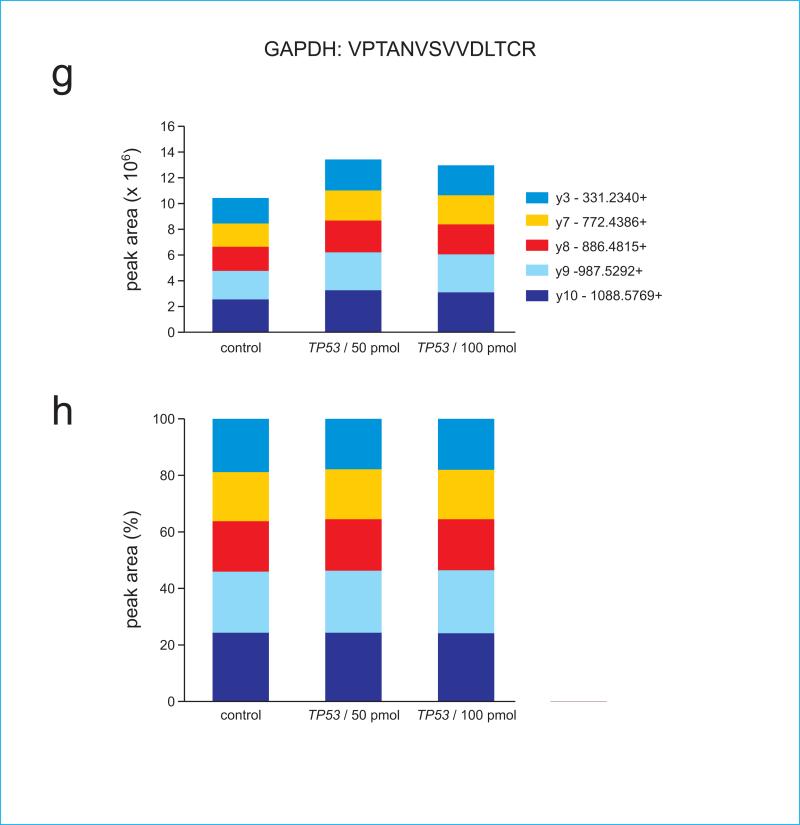
We describe the use of a targeted proteomics approach, selected reaction monitoring (SRM) mass spectrometry, to detect and assess RNAi-mediated depletion or "knockdown" of specific proteins from human cells and from Drosophila flies. This label-free approach does not require any specific reagents to confirm the depletion of RNAi target protein(s) in unfractionated cell or whole organism extracts. The protocol described here is general, can be developed rapidly, and can be multiplexed to detect and measure multiple proteins at once. Furthermore, the methodology can be extended to any tandem mass spectrometer, making it widely accessible. This methodology will be applicable to a wide range of basic science and clinical questions where RNAi-mediated protein depletion needs to be verified, or where differences in relative abundance of target proteins need to be rapidly assessed between samples.


Figures

Figure 1
Figure 1
Outline of selected reaction monitoring mass spectrometry (SRM) workflow. (a) SRM protocol used to detect and quantify a specific target protein versus a control. (b) Experiment design of an SRM experiment to detect and quantify depletion of a target protein in an RNAi experiment using cells or whole organisms.
Figure 2
Figure 2
RNAi-mediated TP53 depletion quantified by Selected Reaction Monitoring (SRM) mass spectrometry. The chromatograms show sets of transitions for specific peptides derived from target protein TP53 (a) or loading control GAPDH (b) in human cell RNAi depletion experiments. Samples were treated with a control RNAi or with 50 or 100 pmol of a TP53-specific siRNA prior to SRM analysis. Specific peptides detected and quantified from TP53 were ALPNNTSSSPQPK and ELNEALELK, and from GAPDH VPTANVSVVDLTCR and IISNASCTTNCLAPLAK. (c) TP53 depletion was quantified from individual peak area ratios determined for all measured peptides and normalized against an internal standard GAPDH as described in Methods. Normalized peptide intensities in depleted and control samples were used to estimate target protein depletion in the RNAi experiment depicted in panels (a) and (b).
Figure 3
Figure 3
Western blot verification of TP53 depletion from human cells. Cells were transfected with TP53-specific or control (C) siRNAs prior to preparing whole cell extracts. TP53 and GAPDH were detected by Western blot analysis. Band intensities for TP53 versus GAPDH were normalized against the blot background, then used to estimate percent TP53 depletion as a function of siRNA dose.
Figure 4
Figure 4
Target protein-specific ion ratios are maintained in samples having different protein abundances. Absolute (a) and normalized (b) ion ratios from TP53 peptide ALPNNSSSPQPK are shown for samples having substantially different amounts of TP53 protein. The first three samples in each panel are unfractionated cell extracts, whereas the final sample (right) in each panel consisted of purified recombinant human TP53 protein. siRNA key indicates transfection of cell samples with a control siRNA or with two different concentrations of TP53-specific siRNA. Panels (c) and (d) show ion ratios for TP53 peptide ELNEALELK, (e) and (f) show ion ratios for GAPDH peptide IISNASCTTNCLAPLAK, and (g) and (h) show ion ratios for GAPDH peptide VPTANVSVVDLTCR. Note that because GAPDH peptides are not present in TP53, their signal is absent in the recombinant TP53 digest.
Figure 4
Figure 4
Target protein-specific ion ratios are maintained in samples having different protein abundances. Absolute (a) and normalized (b) ion ratios from TP53 peptide ALPNNSSSPQPK are shown for samples having substantially different amounts of TP53 protein. The first three samples in each panel are unfractionated cell extracts, whereas the final sample (right) in each panel consisted of purified recombinant human TP53 protein. siRNA key indicates transfection of cell samples with a control siRNA or with two different concentrations of TP53-specific siRNA. Panels (c) and (d) show ion ratios for TP53 peptide ELNEALELK, (e) and (f) show ion ratios for GAPDH peptide IISNASCTTNCLAPLAK, and (g) and (h) show ion ratios for GAPDH peptide VPTANVSVVDLTCR. Note that because GAPDH peptides are not present in TP53, their signal is absent in the recombinant TP53 digest.

References

    1. Hamilton B, Dong Y, Shindo M, Liu W, Odell I, Ruvkun G, Lee SS. A systematic RNAi screen for longevity genes in C. elegans. Genes Dev. 2005;19(13):1544–1555. - PMC - PubMed
    1. Hansen M, Hsu AL, Dillin A, Kenyon C. New genes tied to endocrine, metabolic, and dietary regulation of lifespan from a Caenorhabditis elegans genomic RNAi screen . PLoS. Genet. 2005;1(1):119–128. - PMC - PubMed
    1. Lord CJ, Martin SA, Ashworth A. RNA interference screening demystified. J. Clin. Pathol. 2009;62(3):195–200. - PMC - PubMed
    1. Mohr S, Bakal C, Perrimon N. Genomic screening with RNAi: results and challenges. Annu. Rev. Biochem. 2010;79:37–64. - PMC - PubMed
    1. Mullenders J, Bernards R. Loss-of-function genetic screens as a tool to improve the diagnosis and treatment of cancer. Oncogene. 2009;28(50):4409–4420. - PubMed

Publication types

LinkOut - more resources