

Amyloid-beta isoform metabolism quantitation by stable isotope-labeled kinetics
- PMID: 23714261
- PMCID: PMC3749773
- DOI: 10.1016/j.ab.2013.04.031
Amyloid-beta isoform metabolism quantitation by stable isotope-labeled kinetics
Abstract
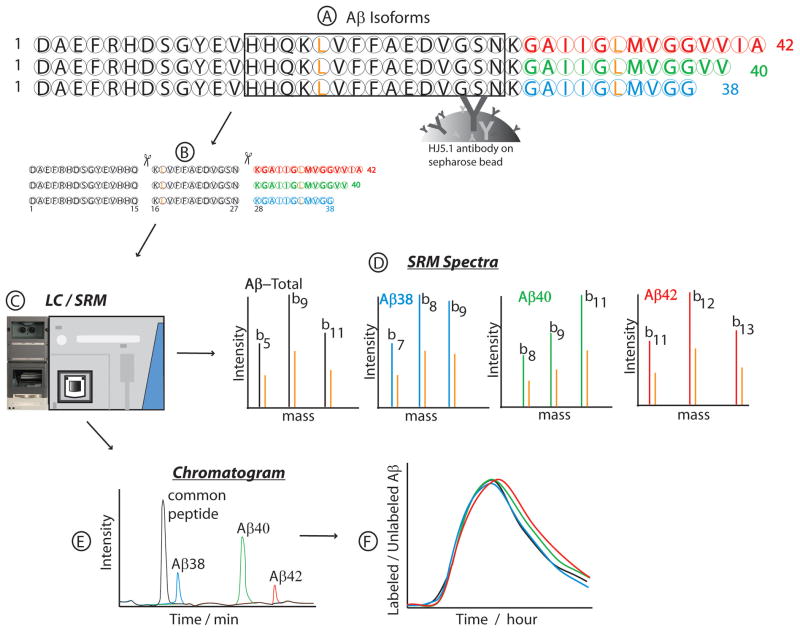
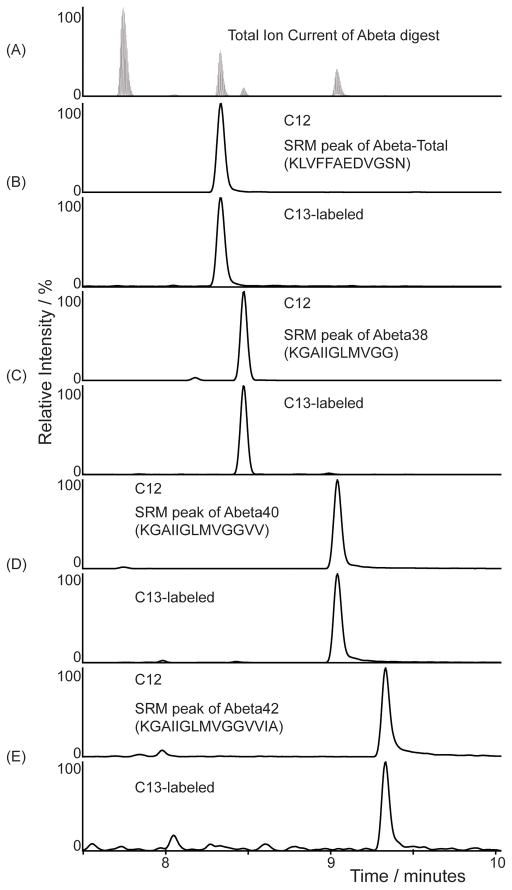
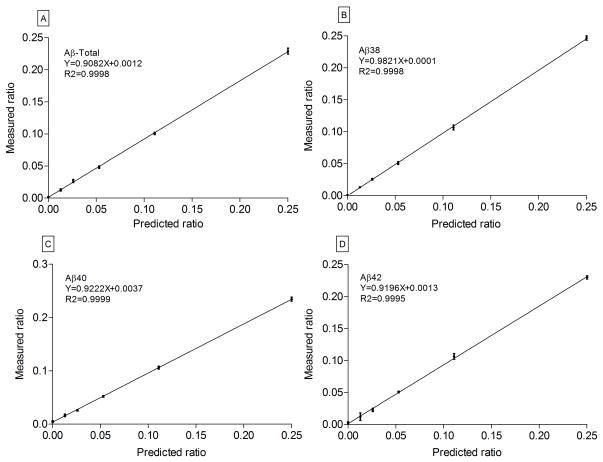
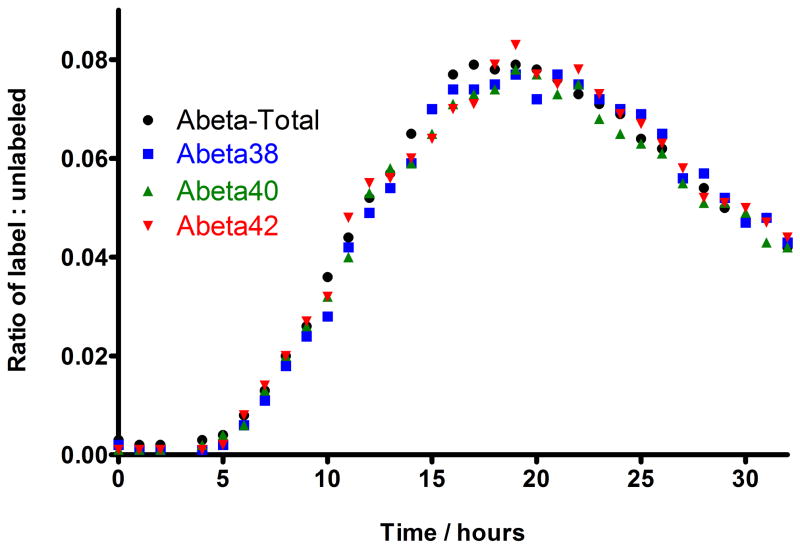
Abundant evidence suggests a central role for the amyloid-beta (Aβ) peptide in Alzheimer's disease (AD) pathogenesis. Production and clearance of different Aβ isoforms have been established as targets of proposed disease-modifying therapeutic treatments of AD. However, previous studies used multiple sequential purification steps to isolate the isoforms individually and quantitate them based on a common mid-domain peptide. We created a method to simultaneously purify Aβ isoforms and quantitate them by the specific C-terminal peptides in order to investigate Aβ isoform physiology in the central nervous system. By using standards generated from in vitro metabolic labeling, the relative quantitation of four peptides representing total amount of Aβ (Aβ-Total), Aβ38, Aβ40, and Aβ42 were achieved both in cell culture and in human cerebrospinal fluid (CSF). Standard curves for each isoform demonstrated good sensitivity with very low limits of detection and high accuracy. Because the assay does not require antibody development for each Aβ isoform peptide, significant improvements in the throughput and accuracy of isoform quantitation were achieved.
Keywords: Alzheimer’s disease; Amyloid-beta isoforms; Cerebrospinal fluid; Mass spectrometry; Relative quantitation.
Copyright © 2013 Elsevier Inc. All rights reserved.
Conflict of interest statement
Competing interests: R.J.B. co-founded C2N Diagnostics and is on the scientific advisory board of C2N Diagnostics which did not support this work. Washington University has a pending patent on material presented in this report with Drs. Bateman and Mawuenyega listed as inventors.
Figures
References
-
- Hardy J, Selkoe DJ. The amyloid hypothesis of Alzheimer’s disease: progress and problems on the road to therapeutics. Science. 2002;297:353–6. - PubMed
-
- Iwatsubo T, Odaka A, Suzuki N, Mizusawa H, Nukina N, Ihara Y. Visualization of A beta 42(43) and A beta 40 in senile plaques with end-specific A beta monoclonals: evidence that an initially deposited species is A beta 42(43) Neuron. 1994;13:45–53. - PubMed
-
- Goate A, Chartier-Harlin MC, Mullan M, Brown J, Crawford F, Fidani L, Giuffra L, Haynes A, Irving N, James L, et al. Segregation of a missense mutation in the amyloid precursor protein gene with familial Alzheimer’s disease. Nature. 1991;349:704–6. - PubMed
-
- Levy-Lahad E, Wijsman EM, Nemens E, Anderson L, Goddard KA, Weber JL, Bird TD, Schellenberg GD. A familial Alzheimer’s disease locus on chromosome 1. Science. 1995;269:970–3. - PubMed
-
- Rovelet-Lecrux A, Hannequin D, Raux G, Le Meur N, Laquerriere A, Vital A, Dumanchin C, Feuillette S, Brice A, Vercelletto M, Dubas F, Frebourg T, Campion D. APP locus duplication causes autosomal dominant early-onset Alzheimer disease with cerebral amyloid angiopathy. Nat Genet. 2006;38:24–6. - PubMed
Publication types
MeSH terms
Substances
Grants and funding
- DK056341/DK/NIDDK NIH HHS/United States
- P30-RR000954/RR/NCRR NIH HHS/United States
- P30 DK056341/DK/NIDDK NIH HHS/United States
- UL1 RR024992/RR/NCRR NIH HHS/United States
- K23 AG030946/AG/NIA NIH HHS/United States
- UL1 TR000448/TR/NCATS NIH HHS/United States
- P30 DK020579/DK/NIDDK NIH HHS/United States
- KL2 RR024994/RR/NCRR NIH HHS/United States
- P41 RR000954/RR/NCRR NIH HHS/United States
- DK020579/DK/NIDDK NIH HHS/United States
- R01 NS065667/NS/NINDS NIH HHS/United States
- R01-NS065667/NS/NINDS NIH HHS/United States
- TL1 RR024995/RR/NCRR NIH HHS/United States
- P60 DK020579/DK/NIDDK NIH HHS/United States
- TL1 TR000449/TR/NCATS NIH HHS/United States
- KL2 RR 024994/RR/NCRR NIH HHS/United States
- KL2 TR000450/TR/NCATS NIH HHS/United States
LinkOut - more resources
Full Text Sources
Other Literature Sources
Medical
